BOOM vs OP: The Epic Battle Between Explosive Plays and Overpowered Strategies in Competitive Gaming
Introduction: Investment Comparison of BOOM vs OP
In the cryptocurrency market, the comparison between BOOM vs OP has always been a topic that investors cannot ignore. The two not only have significant differences in market cap ranking, application scenarios, and price performance, but also represent different positions in crypto assets.
Boom (BOOM): Since its launch, it has gained market recognition as a pioneer AI-powered data incentive layer bridging off-chain activity and on-chain economies.
Optimism (OP): Since its inception, it has been hailed as a low-cost, lightning-fast Ethereum Layer 2 blockchain, addressing the practical needs of developers and users.
This article will comprehensively analyze the investment value comparison between BOOM and OP, focusing on historical price trends, supply mechanisms, institutional adoption, technological ecosystems, and future predictions, attempting to answer the question that concerns investors the most:
"Which is the better buy right now?"
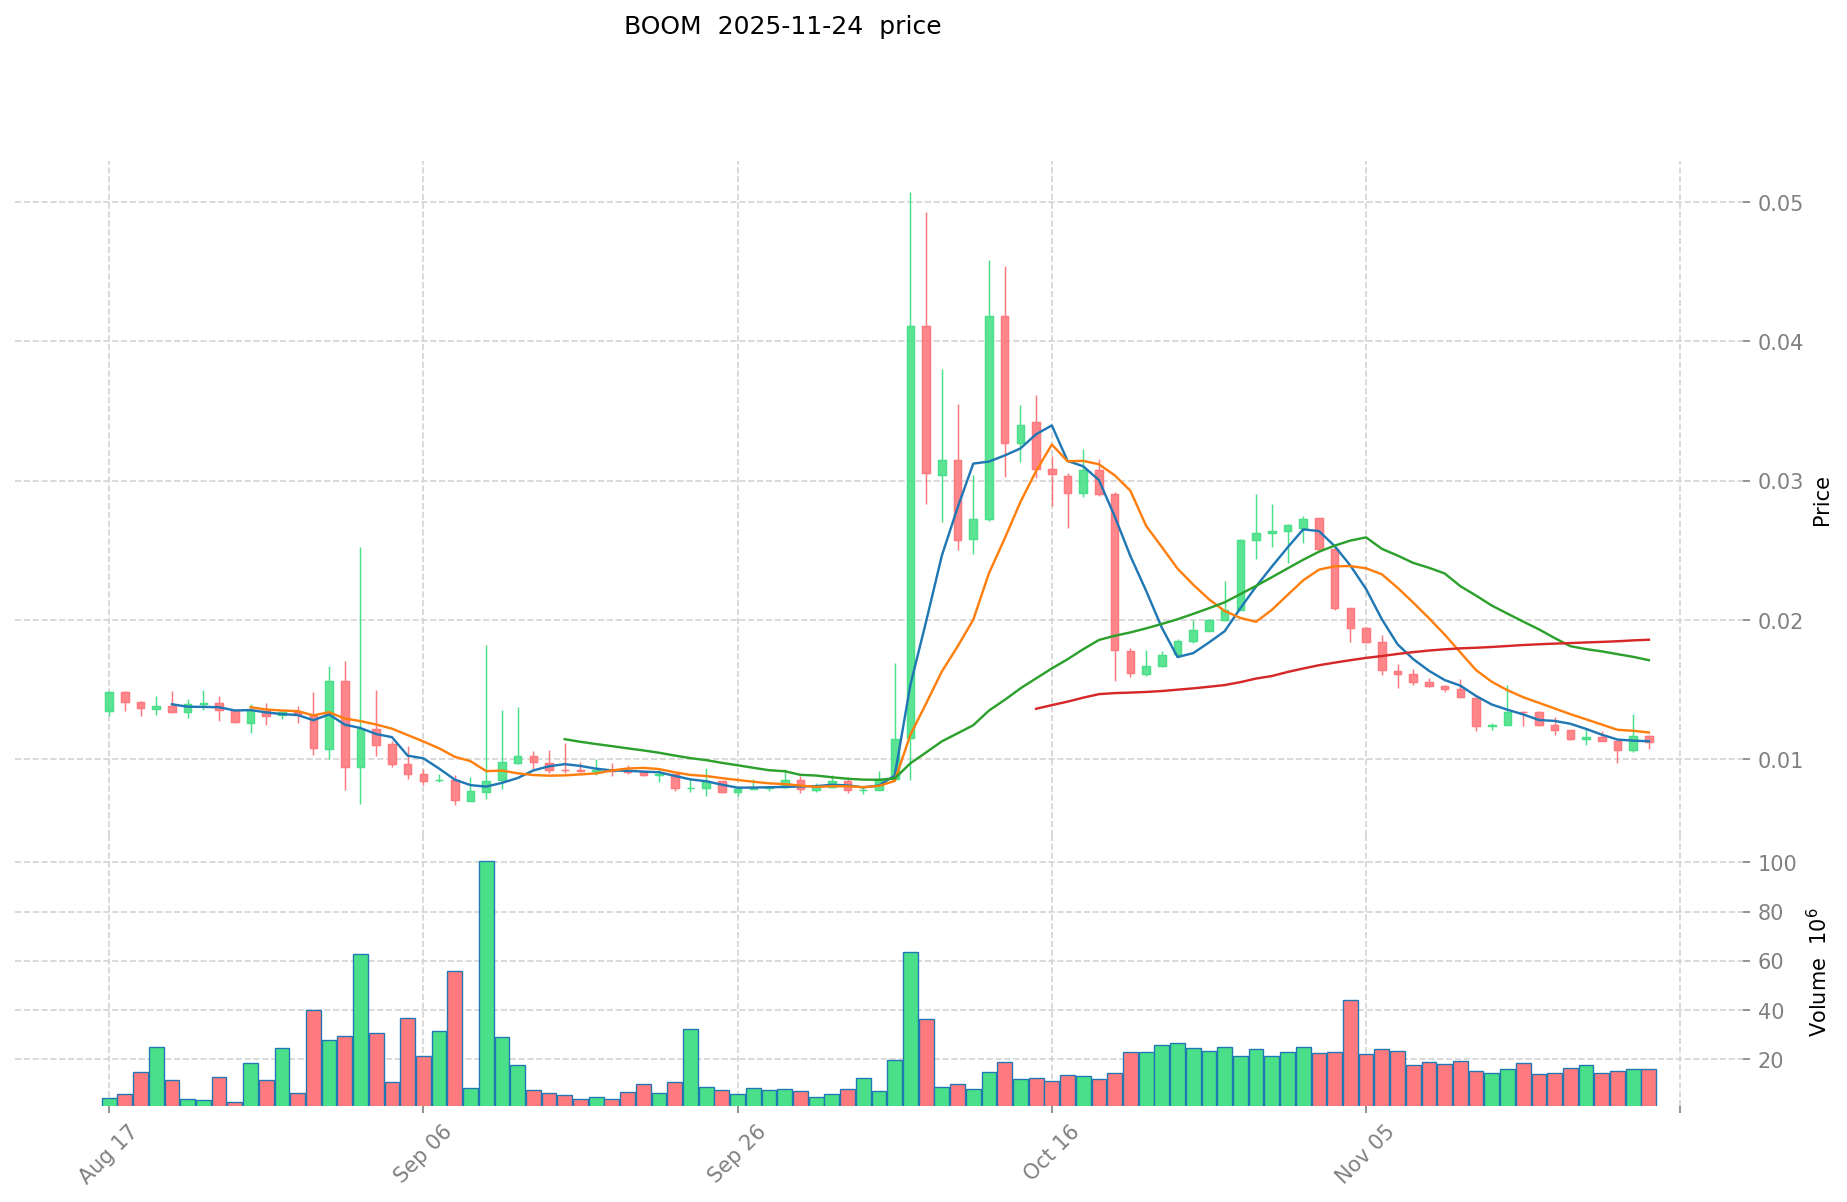
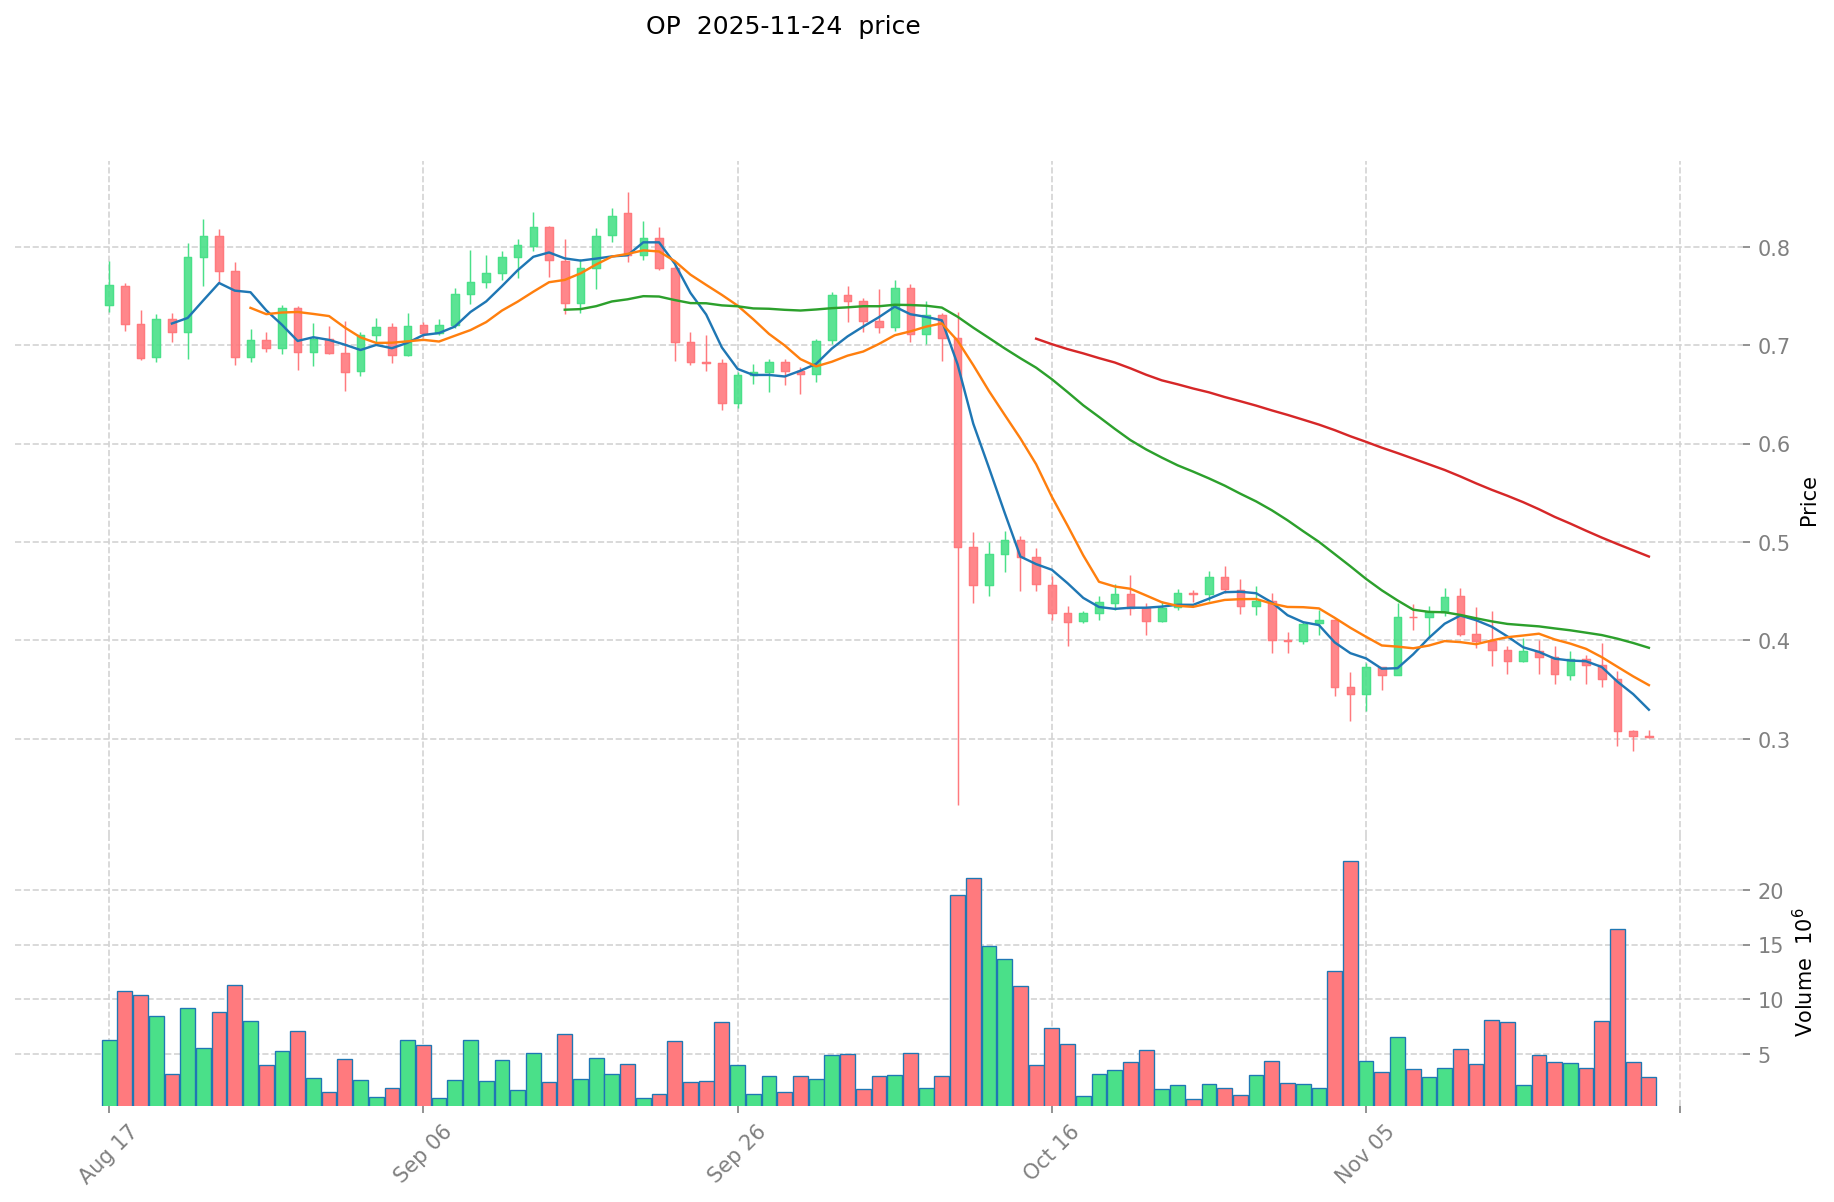
I. Price History Comparison and Current Market Status
BOOM (Coin A) and OP (Coin B) Historical Price Trends
- 2025: BOOM's price dropped to its all-time low of $0.006672 on September 8, 2025, and reached its all-time high of $0.050738 on October 7, 2025.
- 2024: OP reached its all-time high of $4.84 on March 6, 2024.
- Comparative analysis: In the recent market cycle, BOOM has experienced significant volatility, with a price range between $0.006672 and $0.050738. OP, on the other hand, has seen a substantial decline from its all-time high of $4.84 to its current price level.
Current Market Situation (2025-11-24)
- BOOM current price: $0.011161
- OP current price: $0.3073
- 24-hour trading volume: BOOM $185,216.85 vs OP $924,482.22
- Market Sentiment Index (Fear & Greed Index): 19 (Extreme Fear)
Click to view real-time prices:
- View BOOM's current price Market Price
- View OP's current price Market Price
II. Core Factors Affecting Investment Value of BOOM vs OP
Supply Mechanism Comparison (Tokenomics)
- BOOM: Fixed total supply of 1 billion tokens with 93% of BOOM's total supply distributed to the community through retroactive airdrops, farming incentives, and token grants
- OP: Capped total supply with gradual distribution through ecosystem funding, governance airdrops, and retroactive public goods funding
Institutional Adoption and Market Applications
- Institutional Holdings: OP has gained broader institutional interest with Optimism being backed by a16z and other major venture capital firms
- Enterprise Adoption: OP has established more enterprise partnerships through the Optimism Collective's ecosystem
- National Policies: Both projects operate within similar regulatory environments as Layer 2 scaling solutions
Technical Development and Ecosystem Building
- BOOM Technical Upgrades: Implements BOOM Protocol with XP dynamics and improves transaction throughput on Base
- OP Technical Development: Focuses on the development of the OP Stack and Bedrock upgrade to enhance scalability and reduce fees
- Ecosystem Comparison: OP has a more established ecosystem with numerous DeFi applications, while BOOM is still in early development phase with focus on community engagement and gamification elements
Macroeconomic Factors and Market Cycles
- Inflationary Environment Performance: Both tokens serve primarily as governance and utility tokens rather than inflation hedges
- Macroeconomic Monetary Policy: Both are affected similarly by broader crypto market trends in response to monetary policies
- Geopolitical Factors: Layer 2 solutions generally benefit from increased demand for scalable blockchain infrastructure regardless of geopolitical tensions
III. 2025-2030 Price Prediction: BOOM vs OP
Short-term Prediction (2025)
- BOOM: Conservative $0.0060426 - $0.01119 | Optimistic $0.01119 - $0.0130923
- OP: Conservative $0.255557 - $0.3079 | Optimistic $0.3079 - $0.323295
Mid-term Prediction (2027)
- BOOM may enter a growth phase, with an estimated price range of $0.0070242623325 - $0.0171293414775
- OP may enter a consolidation phase, with an estimated price range of $0.1997732175 - $0.349603130625
- Key drivers: Institutional capital inflow, ETFs, ecosystem development
Long-term Prediction (2030)
- BOOM: Base scenario $0.014810384198514 - $0.021464324925383 | Optimistic scenario $0.021464324925383 - $0.022537541171653
- OP: Base scenario $0.361983975892953 - $0.430933304634468 | Optimistic scenario $0.430933304634468 - $0.637781290859013
Disclaimer: The above predictions are based on historical data and market analysis. Cryptocurrency markets are highly volatile and subject to various factors. These projections should not be considered as financial advice. Always conduct your own research before making investment decisions.
BOOM:
| 年份 | 预测最高价 | 预测平均价格 | 预测最低价 | 涨跌幅 |
|---|---|---|---|---|
| 2025 | 0.0130923 | 0.01119 | 0.0060426 | 0 |
| 2026 | 0.0125053845 | 0.01214115 | 0.011655504 | 8 |
| 2027 | 0.0171293414775 | 0.01232326725 | 0.0070242623325 | 10 |
| 2028 | 0.020175036978337 | 0.01472630436375 | 0.009130308705525 | 31 |
| 2029 | 0.025477979179723 | 0.017450670671043 | 0.016578137137491 | 56 |
| 2030 | 0.022537541171653 | 0.021464324925383 | 0.014810384198514 | 92 |
OP:
| 年份 | 预测最高价 | 预测平均价格 | 预测最低价 | 涨跌幅 |
|---|---|---|---|---|
| 2025 | 0.323295 | 0.3079 | 0.255557 | 0 |
| 2026 | 0.350313225 | 0.3155975 | 0.236698125 | 2 |
| 2027 | 0.349603130625 | 0.3329553625 | 0.1997732175 | 8 |
| 2028 | 0.49144211505 | 0.3412792465625 | 0.317389699303125 | 11 |
| 2029 | 0.445505928462687 | 0.41636068080625 | 0.241489194867625 | 35 |
| 2030 | 0.637781290859013 | 0.430933304634468 | 0.361983975892953 | 40 |
IV. Investment Strategy Comparison: BOOM vs OP
Long-term vs Short-term Investment Strategy
- BOOM: Suitable for investors focusing on community engagement and gamification potential
- OP: Suitable for investors seeking established ecosystem and scalability solutions
Risk Management and Asset Allocation
- Conservative investors: BOOM: 20% vs OP: 80%
- Aggressive investors: BOOM: 40% vs OP: 60%
- Hedging tools: Stablecoin allocation, options, cross-currency portfolio
V. Potential Risk Comparison
Market Risk
- BOOM: Higher volatility due to lower market cap and trading volume
- OP: Exposure to broader Ethereum ecosystem risks
Technical Risk
- BOOM: Scalability, network stability on Base
- OP: Centralization concerns, potential security vulnerabilities in Layer 2 technology
Regulatory Risk
- Global regulatory policies may impact both projects as Layer 2 solutions, with OP potentially facing more scrutiny due to its larger ecosystem
VI. Conclusion: Which Is the Better Buy?
📌 Investment Value Summary:
- BOOM advantages: Novel AI-powered data incentive layer, potential for growth in early development stage
- OP advantages: Established ecosystem, institutional backing, proven scalability solution for Ethereum
✅ Investment Advice:
- Novice investors: Consider a smaller allocation to BOOM for higher risk/reward, larger allocation to OP for stability
- Experienced investors: Balanced approach with exposure to both, adjusting based on risk tolerance
- Institutional investors: Higher allocation to OP for established ecosystem, consider BOOM for potential growth opportunities
⚠️ Risk Warning: The cryptocurrency market is highly volatile. This article does not constitute investment advice. None
VII. FAQ
Q1: What are the main differences between BOOM and OP? A: BOOM is an AI-powered data incentive layer focused on community engagement and gamification, while OP is an established Ethereum Layer 2 scaling solution with a broader ecosystem and institutional backing.
Q2: Which token has shown better price performance recently? A: BOOM has experienced higher volatility, with a significant price range in 2025. OP, while declining from its all-time high, has shown more stability in its recent price performance.
Q3: How do the supply mechanisms of BOOM and OP compare? A: BOOM has a fixed total supply of 1 billion tokens, with 93% distributed to the community. OP has a capped total supply with gradual distribution through ecosystem funding and governance airdrops.
Q4: Which project has more institutional adoption? A: OP has gained broader institutional interest, with Optimism being backed by major venture capital firms like a16z. It also has more established enterprise partnerships through its ecosystem.
Q5: What are the key technical developments for each project? A: BOOM is implementing the BOOM Protocol with XP dynamics and improving transaction throughput on Base. OP is focusing on the development of the OP Stack and Bedrock upgrade to enhance scalability and reduce fees.
Q6: How do the long-term price predictions for BOOM and OP compare? A: By 2030, BOOM's base scenario predicts a range of $0.014810384198514 - $0.021464324925383, while OP's base scenario predicts $0.361983975892953 - $0.430933304634468. Both have potential for growth, with OP showing higher projected values.
Q7: What investment strategy is recommended for each token? A: For BOOM, it's suitable for investors focusing on community engagement and potential growth. For OP, it's better for those seeking an established ecosystem and scalability solutions. A balanced approach with exposure to both, adjusted based on risk tolerance, is recommended for experienced investors.
Q8: What are the main risks associated with investing in BOOM and OP? A: BOOM faces higher volatility due to lower market cap and trading volume, as well as potential scalability issues. OP is exposed to broader Ethereum ecosystem risks and potential centralization concerns. Both face regulatory risks as Layer 2 solutions.
Share
Content
Introduction: Investment Comparison of BOOM vs OP
I. Price History Comparison and Current Market Status
II. Core Factors Affecting Investment Value of BOOM vs OP
III. 2025-2030 Price Prediction: BOOM vs OP
IV. Investment Strategy Comparison: BOOM vs OP
V. Potential Risk Comparison
VI. Conclusion: Which Is the Better Buy?
VII. FAQ

