2025 WAT Price Prediction: Expert Analysis and Market Forecast for the Coming Year

Introduction: WAT's Market Position and Investment Value
WatBird (WAT) is a community-first token built on the TON blockchain and backed by TON Ventures, designed as a meme-powered IP aimed at building the next major Web3 brand. Since its launch in September 2024, WAT has garnered millions of daily active users within its existing community. As of January 5, 2026, WAT maintains a fully diluted valuation of $690,418.18 with a circulating supply of approximately 6.59 billion tokens, trading at around $0.000009906. This innovative asset, characterized as a "meme-driven Web3 ecosystem builder," is gaining traction through the combination of casual gaming mechanics and community engagement, leveraging Telegram's vast user base to attract new participants.
This article will provide a comprehensive analysis of WAT's price trajectory from 2026 through 2031, integrating historical patterns, market supply-demand dynamics, ecosystem development progress, and macroeconomic factors to deliver professional price forecasting and actionable investment strategies for market participants.
I. WAT Price History Review and Market Status
WAT Historical Price Trajectory
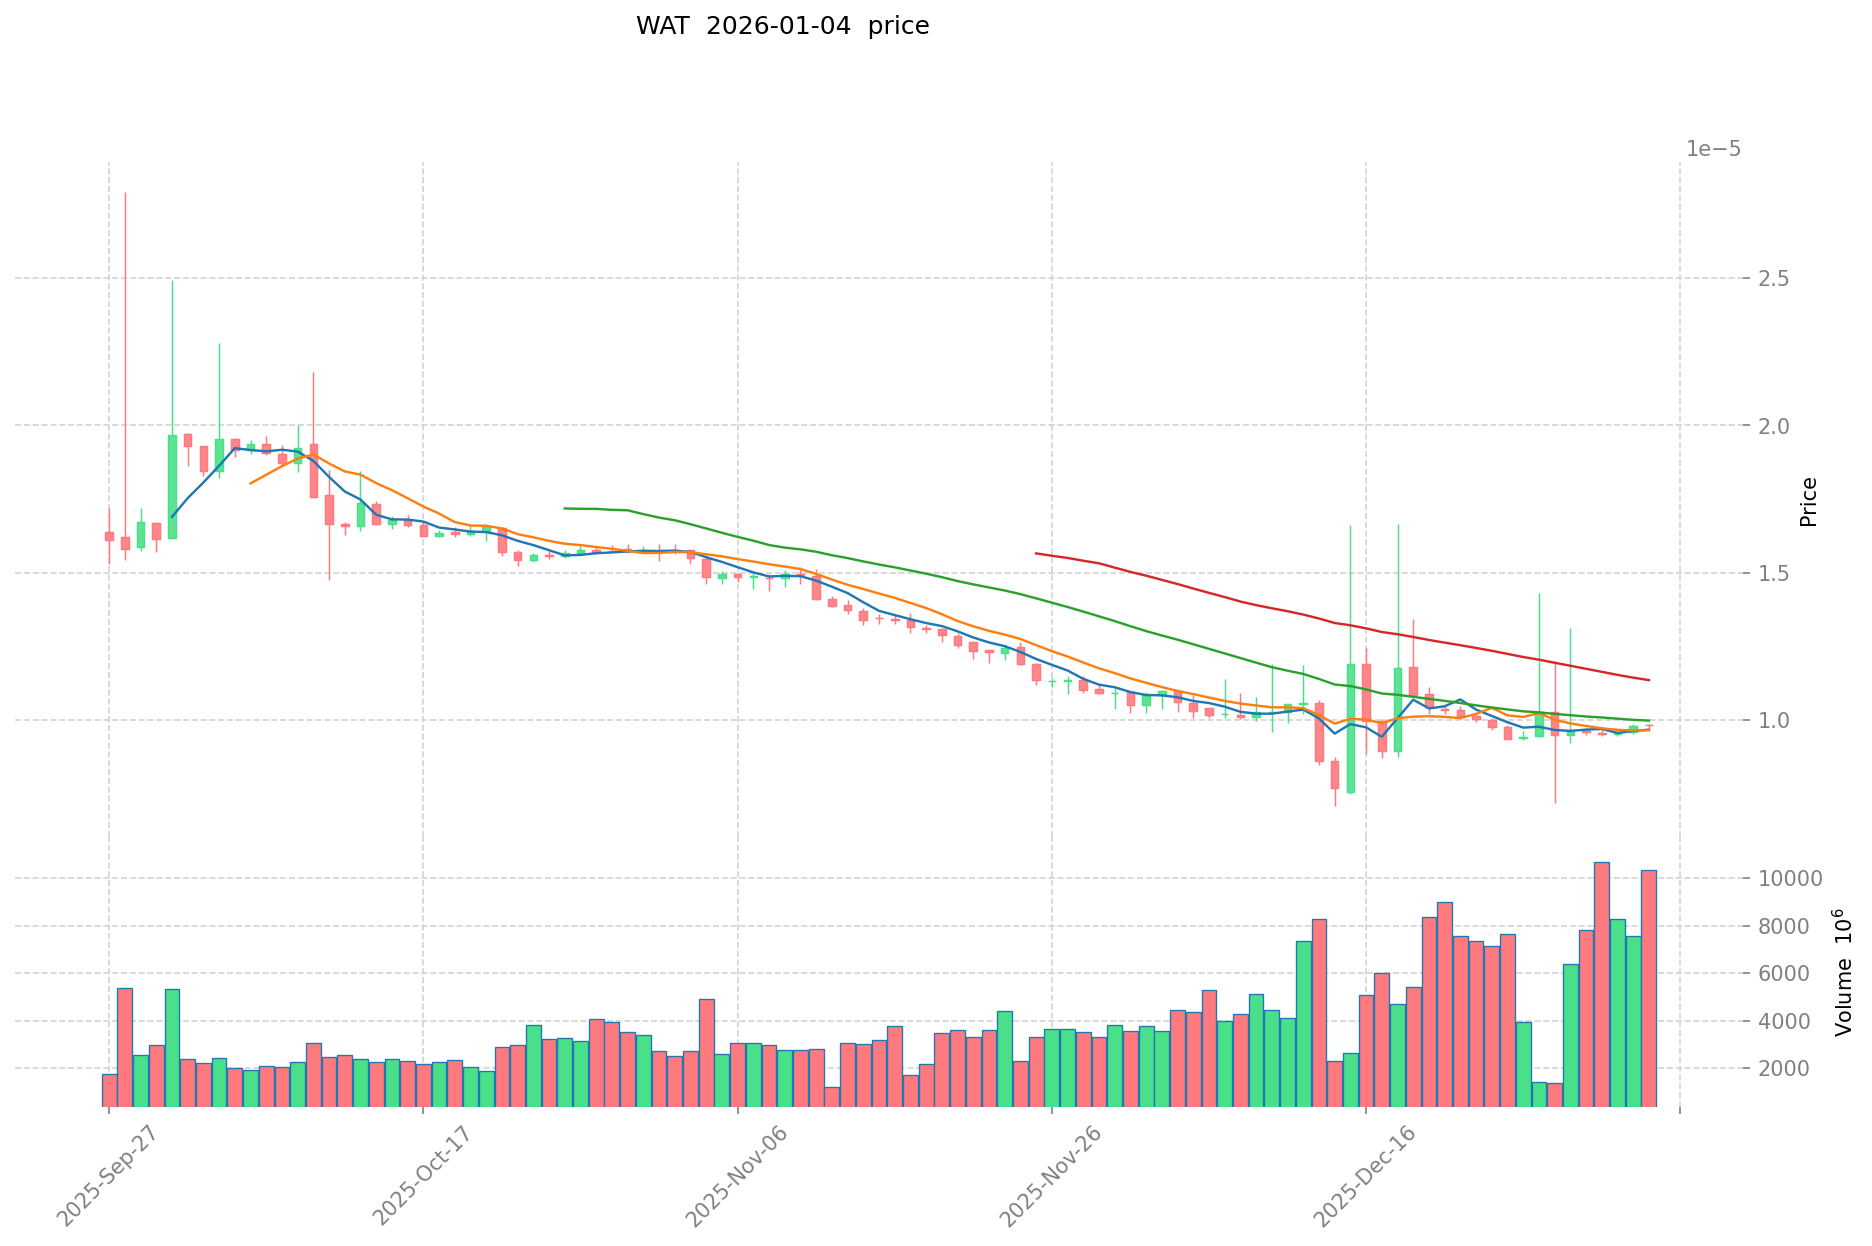
WAT reached its all-time high (ATH) of $0.00217 on September 23, 2024, representing a significant milestone for the token during its early market phase. Following this peak, the token experienced substantial volatility typical of newly launched meme-powered assets. By December 14, 2025, WAT reached its all-time low (ATL) of $0.000007084, marking a significant correction of approximately 94.23% from its launch price of $0.000717391304358.
The token's one-year performance reflects a dramatic 94.23% decline, indicating the challenging market conditions and volatility characteristic of emerging Web3 projects built on the TON blockchain.
WAT Current Market Status
As of January 5, 2026, WAT is trading at $0.000009906, with a 24-hour trading volume of $133,878.13. The token demonstrates recent short-term recovery momentum, gaining 1.24% over the past 24 hours and 0.03% in the last hour. However, the broader trend remains bearish, with the token down 11.23% over the past 7 days and 4.59% over the past 30 days.
The current market capitalization stands at $65,244.52, while the fully diluted valuation (FDV) reaches $690,418.18. WAT maintains a 9.45% market cap to FDV ratio, indicating significant room between current circulating supply and maximum supply. The token is ranked 5403 by market capitalization and represents 0.000020% of the total cryptocurrency market.
With a circulating supply of 6,586,363,636 WAT out of a maximum supply of 69,696,969,696 tokens, the project has distributed approximately 9.45% of its total token supply. The token maintains a holder base of 221,888 addresses, and is currently listed on 2 exchanges.
Click to view current WAT market price
WAT Market Sentiment Index
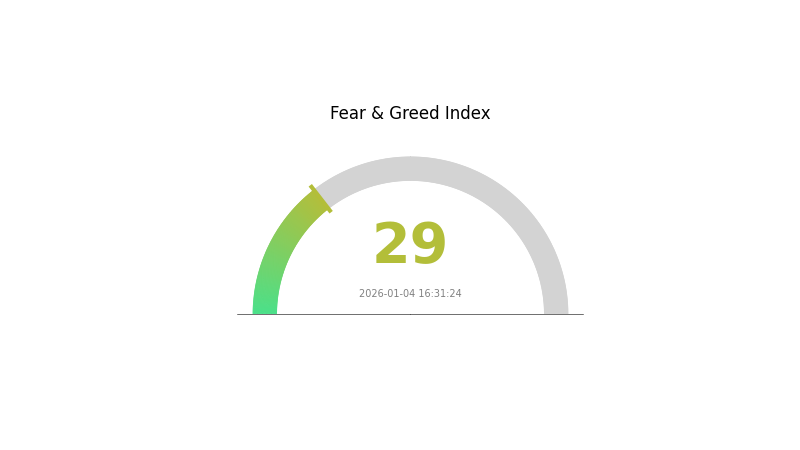
2026-01-04 Fear and Greed Index: 29 (Fear)
Click to view current Fear & Greed Index
The cryptocurrency market is currently experiencing significant fear sentiment, with the Fear and Greed Index standing at 29. This reading indicates heightened market anxiety and risk aversion among investors. When the index enters fear territory, it often presents contrarian opportunities for long-term investors, as excessive pessimism can create buying opportunities at lower prices. However, traders should exercise caution and conduct thorough research before making investment decisions. Monitor market developments closely and consider your risk tolerance when positioning during periods of elevated fear.
WAT Holdings Distribution
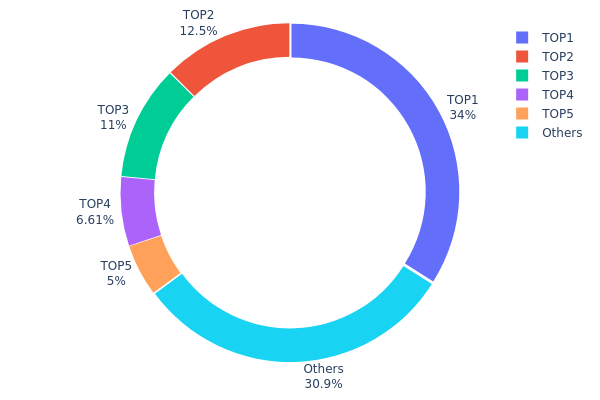
The address holdings distribution map illustrates the concentration of token ownership across different wallet addresses on the blockchain. It serves as a critical metric for assessing the decentralization level and potential market risk exposure of WAT, revealing how token supply is allocated among holders and identifying potential concentration risks that could influence market dynamics and price stability.
Current data demonstrates notable concentration in WAT's holder base. The top five addresses collectively control approximately 69.08% of the total token supply, with the largest holder accounting for 33.98% of all WAT tokens. This level of concentration is substantial, with the leading address alone holding more than one-third of circulating supply. While the remaining 30.92% is distributed across other addresses, the disparity between top holders and the broader holder base suggests a relatively centralized ownership structure that warrants careful monitoring.
Such concentration patterns present several market implications. The significant holdings by top addresses create potential liquidity risks and could amplify price volatility in response to large transactions or movement decisions by major holders. The dominance of the top holder raises questions about market stability and independence, as concentrated ownership could theoretically facilitate coordinated selling pressure or price manipulation during periods of market stress. However, the presence of diversified secondary holdings and a substantial "Others" category indicates that WAT does maintain some level of distribution beyond the elite tier, suggesting the ecosystem has not reached extreme centralization levels typical of newly launched or highly controlled tokens.
Click to view current WAT Holdings Distribution
| Top | Address | Holding Qty | Holding (%) |
|---|---|---|---|
| 1 | UQAZJ6...iljLMs | 23683480.43K | 33.98% |
| 2 | UQAbhM...0d1t87 | 8714196.27K | 12.50% |
| 3 | UQARIM...7_obFt | 7666666.67K | 11.00% |
| 4 | UQA1OM...lNR2dx | 4603872.34K | 6.60% |
| 5 | UQCMqD...WZkNcK | 3484848.48K | 5.00% |
| - | Others | 21543905.51K | 30.92% |
II. Core Factors Impacting WAT's Future Price
Technology Development and Ecosystem Construction
-
Major Technology Upgrades: Significant upgrades, scalability improvements, and security enhancements, as well as new feature rollouts, can influence investor sentiment and impact price movements.
-
Ecosystem Applications: Market demand growth and the expansion of ecosystem applications are key drivers that may push prices upward in the future.
Macroeconomic Environment
- Global Economic Conditions: The overall global economic situation affects investor confidence and risk appetite, which in turn influences WAT's price trajectory. Changes in market sentiment related to macroeconomic factors can have substantial impacts on cryptocurrency valuations.
III. 2026-2031 WAT Price Forecast
2026 Outlook
- Conservative Forecast: $0.00001
- Neutral Forecast: $0.00001
- Optimistic Forecast: $0.00001 (requires sustained market stability)
2027-2029 Medium-term Outlook
- Market Stage Expectation: Gradual accumulation phase with modest price appreciation and increasing adoption momentum.
- Price Range Forecast:
- 2027: $0.00001 (1% growth)
- 2028: $0.00001 (10% growth)
- 2029: $0.00001 (23% growth)
- Key Catalysts: Ecosystem development, institutional interest, and enhanced liquidity on platforms like Gate.com.
2030-2031 Long-term Outlook
- Base Case: $0.00001-$0.00002 (assuming steady technological advancement and market expansion)
- Optimistic Case: $0.00002 (assuming accelerated adoption and positive regulatory developments)
- Transformative Case: $0.00002+ (assuming breakthrough ecosystem integration and mainstream institutional participation)
- January 5, 2026: WAT trading at $0.00001 (stabilization phase)
| 年份 | 预测最高价 | 预测平均价格 | 预测最低价 | 涨跌幅 |
|---|---|---|---|---|
| 2026 | 0.00001 | 0.00001 | 0.00001 | 0 |
| 2027 | 0.00001 | 0.00001 | 0.00001 | 1 |
| 2028 | 0.00001 | 0.00001 | 0.00001 | 10 |
| 2029 | 0.00001 | 0.00001 | 0.00001 | 23 |
| 2030 | 0.00002 | 0.00001 | 0.00001 | 27 |
| 2031 | 0.00002 | 0.00001 | 0.00001 | 44 |
WatBird (WAT) Professional Investment Strategy and Risk Management Report
IV. WAT Professional Investment Strategy and Risk Management
WAT Investment Methodology
(1) Long-term Holding Strategy
- Target Investors: Community-focused crypto enthusiasts, Web3 brand believers, Telegram ecosystem participants
- Operation Recommendations:
- Dollar-cost averaging (DCA) strategy: Allocate fixed amounts at regular intervals to reduce average acquisition cost given the -94.23% one-year performance
- Accumulation phases: Consider increasing positions during market downturns when WAT trades near the historical low of $0.000007084
- Reinvestment approach: Monitor WatBird Universe expansion announcements and reinvest gains during development milestones
(2) Active Trading Strategy
-
Technical Analysis Considerations:
- Volume tracking: Current 24-hour volume of 133,878 indicates relatively low liquidity; monitor for volume spikes before position entries
- Price action levels: Resistance at $0.000009954 (24-hour high) and support at $0.000009715 (24-hour low)
-
Wave Trading Key Points:
- Short-term momentum: 1-hour positive change of 0.03% suggests limited intraday volatility; suitable for swing trading over 3-7 day periods
- 7-day retracement: -11.23% decline over the past week presents potential reversal opportunities
- Community sentiment monitoring: Track Telegram activity and community engagement as leading indicators for price movements
WAT Risk Management Framework
(1) Asset Allocation Principles
- Conservative Investors: 0.5-1% of total portfolio
- Active Investors: 1-3% of total portfolio
- Professional Investors: 3-5% of total portfolio
Note: Given WAT's market cap of $65,244.52 and fully diluted valuation of $690,418.18, this is a highly speculative asset class requiring careful position sizing.
(2) Risk Hedging Approaches
- Diversification strategy: Balance WAT holdings with established TON ecosystem tokens and blue-chip cryptocurrencies to mitigate concentration risk
- Stop-loss implementation: Set protective stops at -20% to -30% below entry prices to limit downside exposure in volatile market conditions
(3) Secure Storage Solutions
- Self-custody option: Store WAT tokens in secure personal wallets with proper seed phrase backup and multi-signature authentication
- Exchange storage: Hold actively traded portions on Gate.com with 2FA security enabled for convenient access and liquidity management
- Security Considerations:
- Never share private keys or recovery phrases
- Use hardware authentication methods for large holdings
- Verify contract address (EQCEqz2x3-Ub_EO4Y5798NNoqKw1tP_tJ6b9y-X0C4uvs8Zf) before transactions
- Beware of phishing attempts targeting Telegram community members
V. WAT Potential Risks and Challenges
WAT Market Risks
- Extreme volatility and price collapse risk: One-year performance of -94.23% demonstrates severe downside potential; token has lost significant value from its all-time high of $0.00217 reached on September 23, 2024
- Low liquidity exposure: With only 2 exchange listings and relatively low trading volume, WAT faces substantial slippage risks and potential difficulty in exiting positions at favorable prices
- Market cap concentration: Fully diluted valuation of only $690,418.18 represents minimal market adoption; token is ranked 5,403 by market cap, indicating marginal market relevance
WAT Regulatory Risks
- Meme token regulatory uncertainty: As a meme-powered IP built on TON blockchain, WAT may face regulatory scrutiny in jurisdictions classifying meme tokens as speculative securities
- Telegram platform dependency: Regulatory actions targeting Telegram or changes to its policies could directly impact WAT's primary user acquisition and community engagement channels
- Geographic restrictions: Varying regulatory frameworks across countries may limit trading accessibility and reduce the addressable user base
WAT Technology Risks
- Smart contract vulnerabilities: As a relatively new token on TON blockchain, ongoing technical audits and potential contract upgrade requirements could introduce operational disruptions
- Blockchain dependency: WAT's entire ecosystem relies on TON network stability; network congestion, security breaches, or protocol changes could negatively impact token functionality
- Adoption execution risk: The WatBird Universe expansion and 100 million user target depend on successful casual game development and MEME culture integration; failure to deliver on these initiatives could significantly diminish investor interest
VI. Conclusion and Action Recommendations
WAT Investment Value Assessment
WatBird (WAT) represents a speculative investment opportunity positioned within the TON ecosystem and Telegram-native gaming sector. The token benefits from TON Ventures backing and an existing community with millions of daily active users. However, the severe one-year decline of -94.23%, minimal market capitalization, low liquidity, and early-stage project maturity present substantial risks. The long-term value proposition depends critically on successful execution of the WatBird Universe expansion, casual gaming integration, and achievement of the 100 million user target. Investors should approach WAT as a high-risk, high-reward venture capital-style investment rather than a core portfolio holding.
WAT Investment Recommendations
✅ Beginners: Start with minimal allocation (0.5% of portfolio) through Gate.com's simple interface; use dollar-cost averaging over 3-6 months to understand price volatility; focus on understanding the WatBird ecosystem and Telegram community fundamentals before increasing exposure
✅ Experienced Investors: Implement technical analysis-based swing trading strategies exploiting the 7-day -11.23% drawdown; maintain strict stop-losses at -25% below entry; actively monitor community sentiment and project development announcements; consider rotating positions based on market cycle phases
✅ Institutional Investors: Conduct comprehensive due diligence on TON ecosystem development, Telegram regulatory landscape, and WatBird team execution track record; establish position limits tied to risk-adjusted portfolio thresholds; maintain separate accounts for research, core holdings, and opportunistic trading
WAT Trading Participation Methods
- Direct exchange trading: Purchase WAT on Gate.com with fiat currency or other cryptocurrencies; utilize limit orders to optimize entry prices amid low liquidity conditions
- Community participation: Engage with WatBird community on Telegram to gain insights on project development, upcoming game releases, and community events that may influence token adoption
- Dollar-cost averaging: Implement systematic weekly or monthly purchases to reduce timing risk and average acquisition cost across volatile price movements
Cryptocurrency investment carries extreme risk. This report does not constitute investment advice. Investors should make decisions based on their individual risk tolerance and consult professional financial advisors. Never invest more capital than you can afford to lose completely.
FAQ
What is WAT, what are its purposes and application scenarios?
WAT is an interactive developer tool providing instant access to API documentation, code examples, and syntax references across programming languages and frameworks. It streamlines development workflows by reducing lookup time and enhancing developer productivity in coding and development processes.
How to conduct WAT price prediction, what analysis methods and tools are available?
WAT price prediction uses technical analysis, fundamental analysis, and on-chain metrics. Key tools include charting platforms for trend analysis, trading volume metrics, market sentiment indicators, and blockchain data trackers. Combine historical price patterns with project developments for comprehensive forecasting.
What are the main factors affecting WAT price?
WAT price is primarily influenced by supply and demand dynamics, market sentiment, network adoption, trading volume, regulatory developments, and overall cryptocurrency market conditions.
What is WAT's historical price trend and what stage is it currently in?
WAT has experienced significant price decline from its historical peak and is currently in a bearish phase. The token is classified as medium-risk, with potential for either price rebound or further downtrend. Market sentiment remains pessimistic.
What risks should I be aware of when investing in WAT?
WAT investment carries market volatility risks. Cryptocurrency prices fluctuate rapidly based on market sentiment, regulatory changes, and adoption rates. Investors should carefully assess their risk tolerance and only invest capital they can afford to lose.
What are the advantages and disadvantages of WAT compared to similar tokens?
WAT offers lower transaction fees and faster processing compared to many similar tokens, but its utility and adoption are still developing. It lacks the widespread use and ecosystem support of more established coins.
What is the professional institution's price prediction for WAT?
Professional institutions predict WAT's price for 2026 will reach approximately US$0.00 based on 5% price volatility forecasts. Predictions may be influenced by institutional adoption rates, sustained ETF demand, and broader macroeconomic trends.
Share
Content
Introduction: WAT's Market Position and Investment Value
I. WAT Price History Review and Market Status
II. Core Factors Impacting WAT's Future Price
III. 2026-2031 WAT Price Forecast
IV. WAT Professional Investment Strategy and Risk Management
V. WAT Potential Risks and Challenges
VI. Conclusion and Action Recommendations
FAQ
How to Buy Cryptocurrency


Trending Cryptocurrencies


2025 WAT Price Prediction: Expert Analysis and Market Forecast for the Upcoming Year

2025 DOGA Price Prediction: Will This Meme Coin Reach New Heights or Face a Downturn?

What is DUREV: The Revolutionary Approach to Sustainable Urban Development
What Will Notcoin's Price Be in 2026: Analyzing NOT's Volatility and $0.011832 Prediction
Is WatBird (WAT) a good investment?: A Comprehensive Analysis of Risk, Potential Returns, and Market Outlook for 2024
GALA Coin (GALA) – Web3 Gaming Token Overview, Price Prediction & Trading on Gate.com

How to Stake Chainlink: A Step-by-Step Guide to LINK Staking

AlphaArena Model Launch: How AI is Redefining Crypto Trading with Real-World Benchmarks

How to Participate in Chainlink Airdrop

SpaceX Transfers $105 Million in Bitcoin to Unmarked Wallets

Why Do We Celebrate Bitcoin Pizza Day?