2025 TRA Price Prediction: Bullish Trends and Key Factors Shaping the Token's Future Value
Introduction: TRA's Market Position and Investment Value
Trabzonspor Fan Token (TRA), as a fan token representing the Turkish Football Club Trabzonspor on the Chiliz platform, has been empowering fans with unique rights since its inception. As of 2025, TRA's market capitalization has reached $1,898,840, with a circulating supply of approximately 7,400,000 tokens, and a price hovering around $0.2566. This asset, known as a "sports fan engagement token," is playing an increasingly crucial role in the realm of sports fan interaction and team support.
This article will comprehensively analyze TRA's price trends from 2025 to 2030, combining historical patterns, market supply and demand, ecosystem development, and macroeconomic factors to provide investors with professional price predictions and practical investment strategies.
I. TRA Price History Review and Current Market Status
TRA Historical Price Evolution
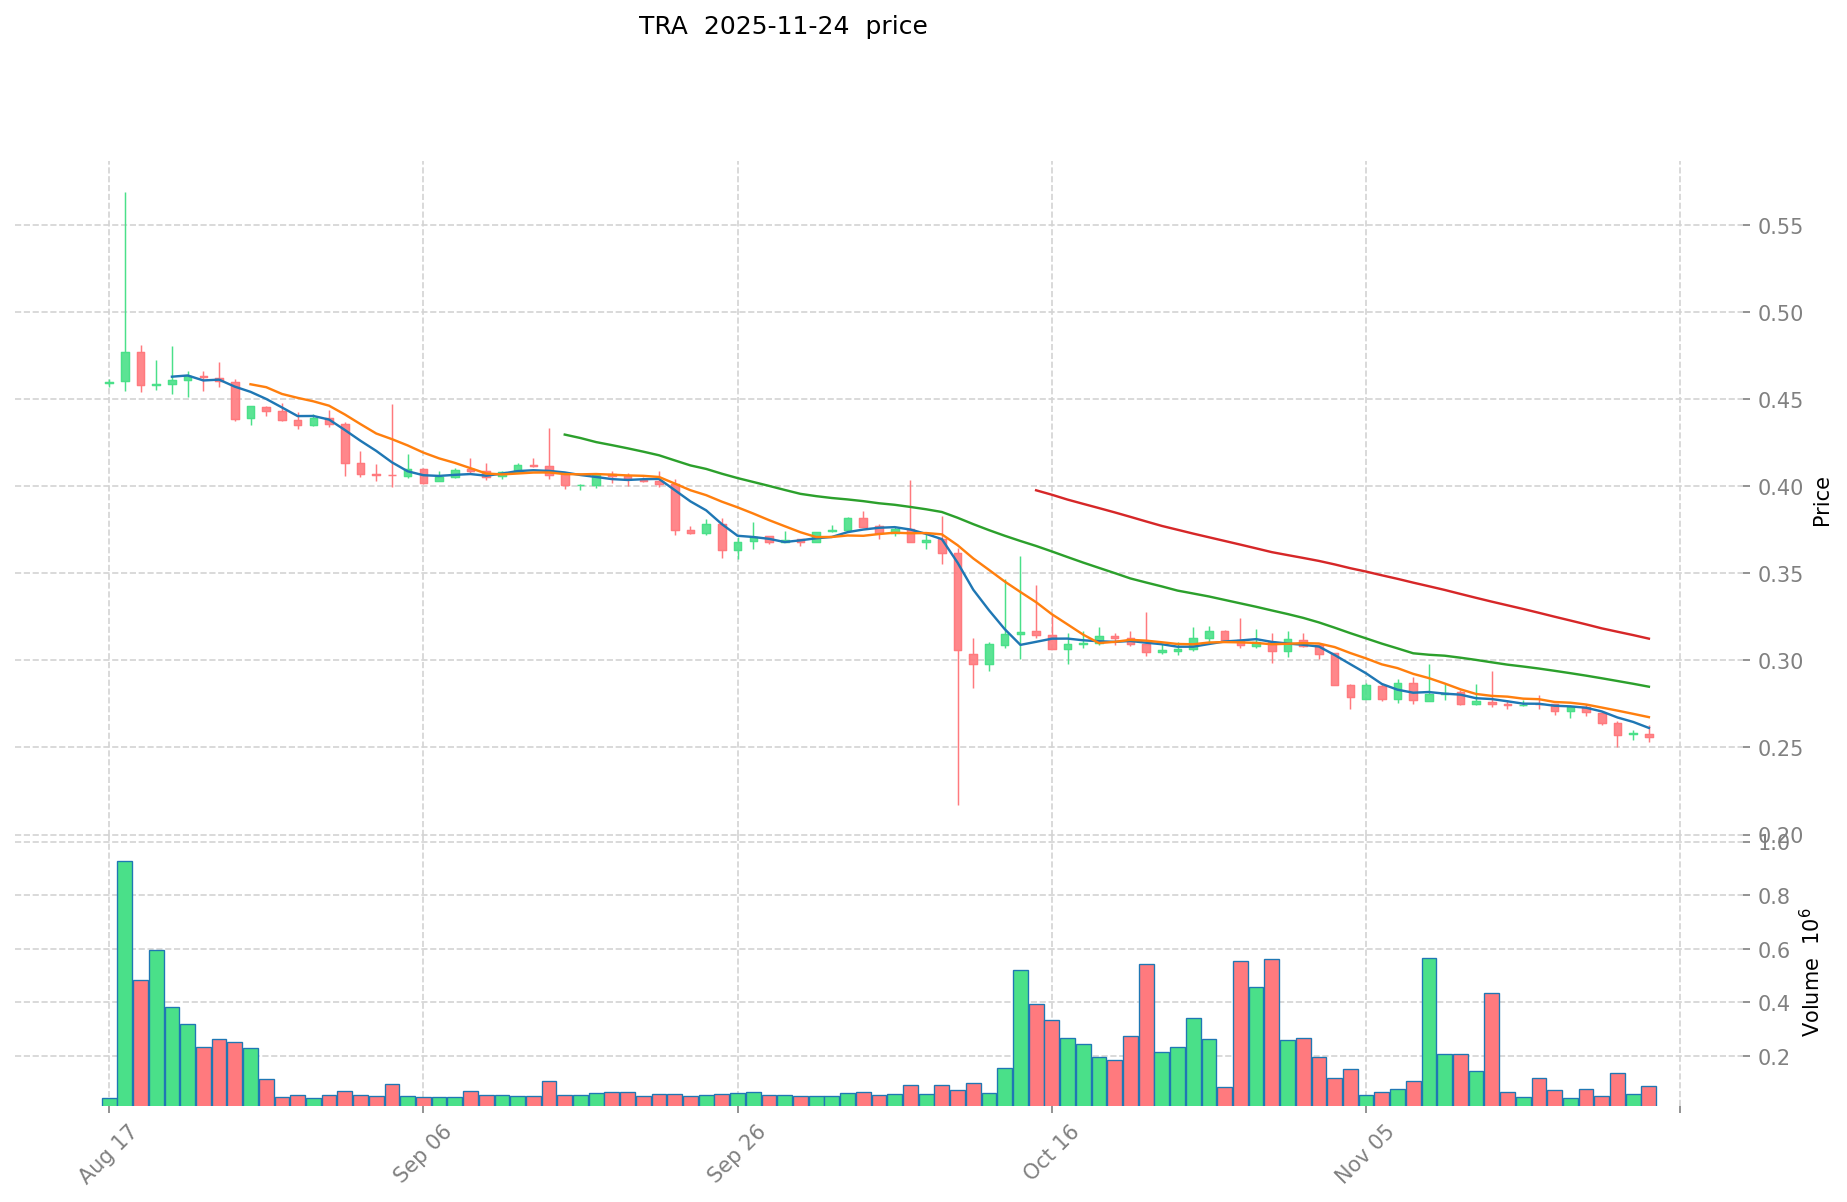
- 2022: Reached all-time high of $9.77 on April 1st
- 2023-2024: Gradual decline in price as cryptocurrency market faced challenges
- 2025: Continued downward trend, reaching all-time low of $0.253495 on November 24th
TRA Current Market Situation
TRA is currently trading at $0.2566, down 0.42% in the last 24 hours. The token has experienced significant price depreciation over the past year, with a 70.25% decrease. Short-term trends also show continued downward pressure, with drops of 5.52% over the past week and 16.5% over the last month. The current price is 97.37% below its all-time high, reflecting the severe market correction TRA has undergone. With a market cap of $1,898,840 and a fully diluted valuation of $2,566,000, TRA ranks 2184th in the cryptocurrency market. The circulating supply of 7,400,000 TRA represents 74% of the total supply, indicating a relatively high proportion of tokens in circulation.
Click to view current TRA market price
TRA Market Sentiment Indicator
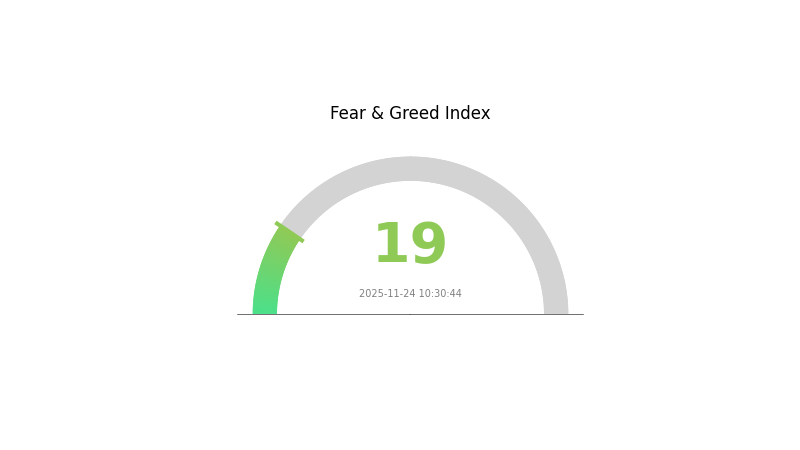
2025-11-24 Fear and Greed Index: 19 (Extreme Fear)
Click to view the current Fear & Greed Index
The crypto market is currently experiencing extreme fear, with the Fear and Greed Index at a low of 19. This indicates a highly pessimistic sentiment among investors. During such periods, many traders become overly cautious, potentially leading to overselling. However, seasoned investors often view these moments as opportunities to accumulate assets at discounted prices. It's crucial to remember that market sentiment can shift rapidly, and thorough research is essential before making any investment decisions.
TRA Holdings Distribution
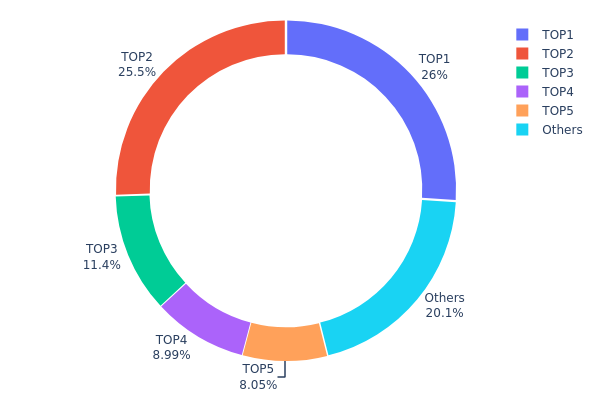
The address holdings distribution data reveals a highly concentrated ownership structure for TRA tokens. The top five addresses collectively hold 79.92% of the total supply, with the two largest holders controlling 51.50% combined. This level of concentration raises concerns about centralization and potential market manipulation.
The top address holds 26.00% of TRA tokens, while the second-largest holds 25.50%, indicating a significant concentration of power in the hands of a few entities. This concentration could lead to increased price volatility and susceptibility to large-scale market movements initiated by these major holders. Furthermore, the high concentration may impact the token's liquidity and overall market stability, as large sell-offs from these addresses could significantly affect the price.
From a market structure perspective, this distribution suggests a relatively low level of decentralization for TRA. The current ownership pattern may pose challenges for achieving widespread adoption and could potentially deter smaller investors due to concerns about market fairness and manipulation risks. Monitoring changes in this distribution over time will be crucial for assessing the evolution of TRA's market dynamics and overall health.
Click to view the current TRA Holdings Distribution
| Top | Address | Holding Qty | Holding (%) |
|---|---|---|---|
| 1 | 0x6F45...41a33D | 2600.00K | 26.00% |
| 2 | 0xc368...816880 | 2550.00K | 25.50% |
| 3 | 0x76eC...78Fbd3 | 1137.86K | 11.38% |
| 4 | 0x0213...F3cF97 | 899.16K | 8.99% |
| 5 | 0xb334...66e1eF | 804.95K | 8.05% |
| - | Others | 2008.02K | 20.08% |
II. Key Factors Affecting TRA's Future Price
Supply Mechanism
- Price Trend: Short-term momentum, volatility, and trading volume situations
- Historical Pattern: When prices rise rapidly, overbought conditions occur; when prices fall sharply in a short time, oversold conditions appear
Institutional and Whale Dynamics
- Corporate Adoption: Adoption of TRA by well-known enterprises
Macroeconomic Environment
- Inflation Hedging Properties: Performance in inflationary environments
- Geopolitical Factors: Impact of international situations
Technical Development and Ecosystem Building
- Market Volatility: Changes in market volatility affecting TRA price movements
- Investor Behavior: Actions of different market participants, including hedgers, arbitrageurs, and speculators
III. TRA Price Prediction for 2025-2030
2025 Outlook
- Conservative prediction: $0.19952 - $0.2558
- Neutral prediction: $0.2558 - $0.28
- Optimistic prediction: $0.28 - $0.30952 (requires positive market sentiment)
2027-2028 Outlook
- Market phase expectation: Potential growth phase
- Price range forecast:
- 2027: $0.24841 - $0.39869
- 2028: $0.25041 - $0.40912
- Key catalysts: Increasing adoption and technological advancements
2030 Long-term Outlook
- Base scenario: $0.4628 - $0.55 (assuming steady market growth)
- Optimistic scenario: $0.55 - $0.68031 (assuming strong market performance)
- Transformative scenario: $0.68031+ (extreme favorable conditions)
- 2030-12-31: TRA $0.68031 (potential peak price)
| 年份 | 预测最高价 | 预测平均价格 | 预测最低价 | 涨跌幅 |
|---|---|---|---|---|
| 2025 | 0.30952 | 0.2558 | 0.19952 | 0 |
| 2026 | 0.33071 | 0.28266 | 0.18655 | 10 |
| 2027 | 0.39869 | 0.30669 | 0.24841 | 19 |
| 2028 | 0.40912 | 0.35269 | 0.25041 | 37 |
| 2029 | 0.54469 | 0.3809 | 0.35043 | 48 |
| 2030 | 0.68031 | 0.4628 | 0.28693 | 80 |
IV. TRA Professional Investment Strategies and Risk Management
TRA Investment Methodology
(1) Long-term Holding Strategy
- Suitable for: Fan token enthusiasts and long-term sports industry investors
- Operational suggestions:
- Accumulate TRA tokens during market dips
- Stay informed about Trabzonspor's performance and fan engagement initiatives
- Store tokens securely in a non-custodial wallet
(2) Active Trading Strategy
- Technical analysis tools:
- Relative Strength Index (RSI): Use to identify overbought and oversold conditions
- Moving Averages: Track short-term and long-term trends
- Key points for swing trading:
- Monitor team performance and fan sentiment
- Watch for announcements of new fan token utilities or partnerships
TRA Risk Management Framework
(1) Asset Allocation Principles
- Conservative investors: 1-3%
- Aggressive investors: 5-10%
- Professional investors: Up to 15%
(2) Risk Hedging Solutions
- Diversification: Spread investments across multiple fan tokens and other crypto assets
- Stop-loss orders: Set appropriate stop-loss levels to limit potential losses
(3) Secure Storage Solutions
- Hot wallet recommendation: Gate Web3 Wallet
- Cold storage option: Hardware wallet for long-term holdings
- Security precautions: Enable two-factor authentication, use strong passwords, and regularly update software
V. Potential Risks and Challenges for TRA
TRA Market Risks
- Volatility: Fan tokens can experience significant price swings based on team performance
- Liquidity: Limited trading volume may lead to slippage during large trades
- Market sentiment: Overall crypto market trends can impact fan token valuations
TRA Regulatory Risks
- Uncertain regulations: Potential changes in cryptocurrency regulations could affect fan tokens
- Sports industry compliance: Evolving rules around fan engagement and tokenization in sports
- Cross-border restrictions: Varying legal status of fan tokens in different jurisdictions
TRA Technical Risks
- Smart contract vulnerabilities: Potential security issues in the underlying token contract
- Blockchain network congestion: High transaction fees or delays during peak usage periods
- Wallet security: Risk of loss due to phishing attacks or user error
VI. Conclusion and Action Recommendations
TRA Investment Value Assessment
TRA offers unique exposure to the sports fan engagement sector, with potential for growth as the concept of fan tokens expands. However, it carries significant short-term volatility and regulatory uncertainties.
TRA Investment Recommendations
✅ Beginners: Start with small positions and focus on learning about fan token ecosystems ✅ Experienced investors: Consider TRA as part of a diversified crypto portfolio, with regular rebalancing ✅ Institutional investors: Explore TRA for thematic exposure to sports industry digitalization trends
TRA Trading Participation Methods
- Spot trading: Buy and sell TRA tokens on Gate.com
- Staking: Participate in fan token staking programs if available
- Fan engagement: Utilize TRA tokens for voting and other fan-related activities on the Trabzonspor platform
Cryptocurrency investments carry extremely high risks, and this article does not constitute investment advice. Investors should make decisions carefully based on their own risk tolerance and are advised to consult professional financial advisors. Never invest more than you can afford to lose.
FAQ
Will TRX reach $1 in 2025?
Based on current projections, TRX is unlikely to reach $1 in 2025. Forecasts suggest a maximum price of around $0.73 for TRX in 2025.
Can Trx go to $10?
While ambitious, TRX reaching $10 is possible with significant ecosystem growth, increased adoption, and favorable market conditions. However, it would require a substantial market cap increase and may take considerable time.
What will TRX be worth in 5 years?
Based on current market trends, TRX is projected to reach approximately $1.50 in 5 years, showing significant growth potential in the crypto market.
How high will Tellor go?
Tellor is projected to reach an average price of $48.91 by 2025, driven by increased adoption of decentralized oracles and demand for off-chain data in smart contracts.
Share
Content
Introduction: TRA's Market Position and Investment Value
I. TRA Price History Review and Current Market Status
II. Key Factors Affecting TRA's Future Price
III. TRA Price Prediction for 2025-2030
IV. TRA Professional Investment Strategies and Risk Management
V. Potential Risks and Challenges for TRA
VI. Conclusion and Action Recommendations
FAQ

