2025 TICO Price Prediction: Analyzing Market Trends and Future Prospects for the Digital Asset
Introduction: TICO's Market Position and Investment Value
Funtico (TICO), as a pioneering Web3 gaming platform, has made significant strides since its inception. As of 2025, TICO's market capitalization stands at $2,729,760, with a circulating supply of approximately 1,880,000,000 tokens, and a price hovering around $0.001452. This asset, dubbed the "GameFi innovator," is playing an increasingly crucial role in the intersection of gaming and blockchain technology.
This article will comprehensively analyze TICO's price trends from 2025 to 2030, combining historical patterns, market supply and demand, ecosystem development, and macroeconomic factors to provide investors with professional price predictions and practical investment strategies.
I. TICO Price History Review and Current Market Status
TICO Historical Price Evolution
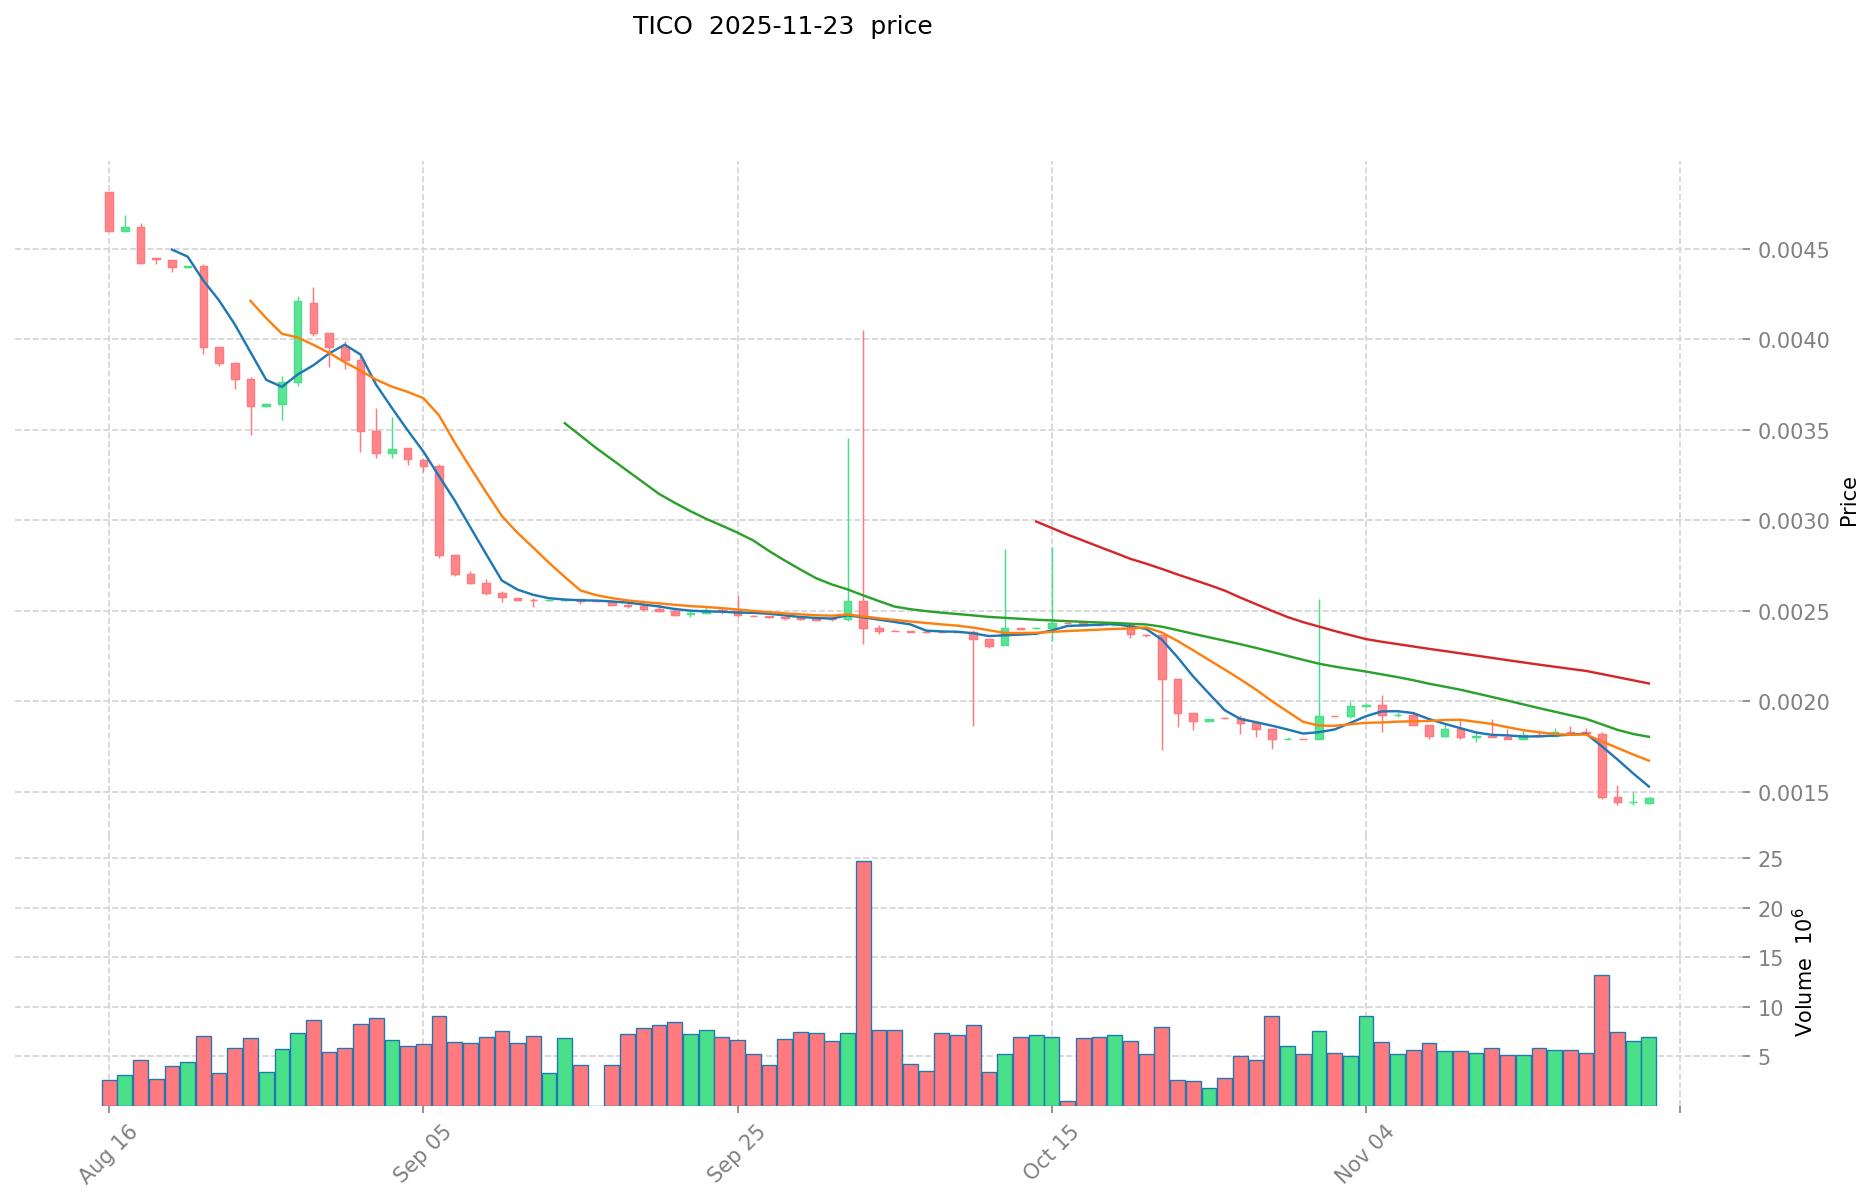
- 2025 January: TICO reached its all-time high of $0.0315, marking a significant milestone for the project.
- 2025 November: TICO experienced a substantial decline, reaching its all-time low of $0.001425.
TICO Current Market Situation
As of November 24, 2025, TICO is trading at $0.001452. The token has seen a slight decrease of 0.27% in the last 24 hours. The current price is significantly lower than its all-time high, representing a 95.39% decrease from its peak. The token's market cap stands at $2,729,760, with a circulating supply of 1,880,000,000 TICO.
TICO has shown negative performance across various timeframes. In the past week, it has declined by 20.7%, and over the last 30 days, it has dropped by 23.13%. The most substantial decline is observed in the one-year timeframe, with a staggering 91.016% decrease.
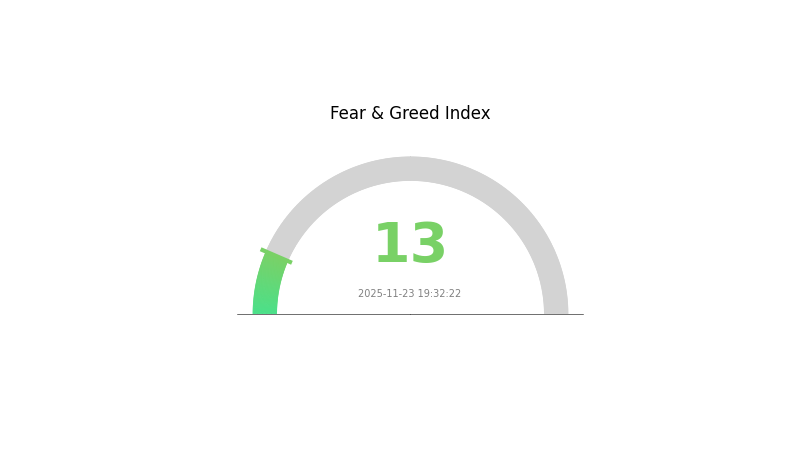
The trading volume in the last 24 hours is $10,267.11, indicating relatively low liquidity compared to its market cap. The current market sentiment for cryptocurrencies is described as "Extreme Fear," with a VIX index of 13, suggesting a highly cautious approach from investors.
Click to view the current TICO market price
TICO Market Sentiment Indicator
2025-11-23 Fear and Greed Index: 13 (Extreme Fear)
Click to view the current Fear & Greed Index
The crypto market is currently gripped by extreme fear, with the Fear and Greed Index plummeting to 13. This level of pessimism often signals a potential buying opportunity for contrarian investors. However, it's crucial to approach with caution and conduct thorough research. While fear may create discounts, it's essential to remember that market sentiment can shift rapidly. Diversification and risk management remain key strategies in navigating these turbulent waters. Stay informed and consider consulting with financial advisors before making any investment decisions.
TICO Holdings Distribution
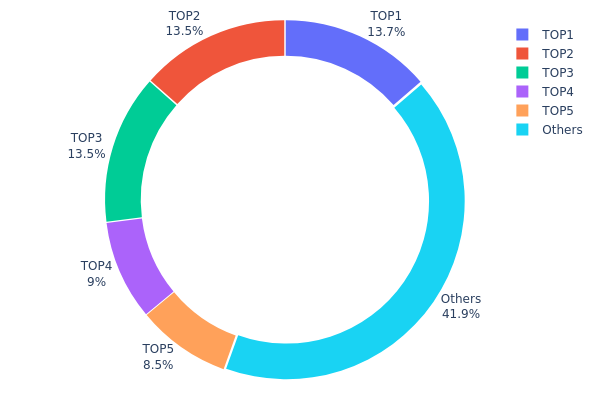
The address holdings distribution chart for TICO reveals a significant concentration among the top holders. The top five addresses collectively control 58.15% of the total TICO supply, with the remaining 41.85% distributed among other addresses. The top three addresses each hold approximately 13.5% of the supply, indicating a high level of centralization.
This concentration of holdings raises concerns about potential market manipulation and price volatility. With such a large portion of the supply controlled by a few addresses, any significant movement or liquidation by these major holders could have a substantial impact on TICO's market price and trading volume. Furthermore, this centralization may undermine the project's claims of decentralization and could potentially affect investor confidence.
The current distribution structure suggests a relatively low level of on-chain decentralization for TICO. While this concentration might provide some stability in terms of large holders potentially having long-term interests, it also poses risks to market integrity and fairness. Potential investors should carefully consider these factors when evaluating TICO's market dynamics and long-term prospects.
Click to view the current TICO Holdings Distribution
| Top | Address | Holding Qty | Holding (%) |
|---|---|---|---|
| 1 | 0xf768...5d9311 | 1365000.00K | 13.65% |
| 2 | 0x8fee...b2661b | 1350000.00K | 13.50% |
| 3 | 0x20af...c01c87 | 1350000.00K | 13.50% |
| 4 | 0x3c53...e4c579 | 900000.00K | 9.00% |
| 5 | 0x5ef6...387b87 | 850000.00K | 8.50% |
| - | Others | 4185000.00K | 41.85% |
II. Key Factors Affecting TICO's Future Price
Supply Mechanism
- Deflationary Model: TICO implements a deflationary model, which may create scarcity over time.
- Historical Pattern: Previous supply changes have shown a tendency to positively impact price due to reduced circulating supply.
- Current Impact: The ongoing deflationary mechanism is expected to continue supporting price stability and potential appreciation.
Institutional and Whale Dynamics
- Institutional Holdings: Major crypto investment firms have been accumulating TICO, indicating growing institutional interest.
- Corporate Adoption: Several tech startups have begun integrating TICO into their payment systems, broadening its use case.
Macroeconomic Environment
- Monetary Policy Impact: Central banks' shift towards tightening monetary policies may affect TICO's attractiveness as an alternative investment.
- Inflation Hedging Properties: TICO has demonstrated some resilience during inflationary periods, potentially positioning it as a hedge.
- Geopolitical Factors: Ongoing global tensions have increased interest in decentralized assets like TICO.
Technological Development and Ecosystem Building
- Layer 2 Integration: TICO is planning to implement Layer 2 solutions to improve scalability and reduce transaction costs.
- Cross-Chain Compatibility: Development of cross-chain bridges to enhance interoperability with other blockchain networks.
- Ecosystem Applications: Several DeFi protocols and NFT marketplaces have been built on the TICO network, expanding its utility.
III. TICO Price Prediction for 2025-2030
2025 Outlook
- Conservative prediction: $0.00118 - $0.00135
- Neutral prediction: $0.00135 - $0.00155
- Optimistic prediction: $0.00155 - $0.00197 (requires strong market recovery and increased adoption)
2027 Mid-term Outlook
- Market stage expectation: Potential consolidation phase with gradual upward trend
- Price range forecast:
- 2026: $0.00129 - $0.00209
- 2027: $0.00139 - $0.00205
- Key catalysts: Broader cryptocurrency market recovery, increased utility of TICO token, and potential partnerships
2030 Long-term Outlook
- Base scenario: $0.00213 - $0.00260 (assuming steady growth and adoption)
- Optimistic scenario: $0.00260 - $0.00287 (assuming strong market conditions and expanded use cases)
- Transformative scenario: $0.00287 - $0.00308 (extreme favorable conditions such as major institutional adoption)
- 2030-11-24: TICO $0.00260 (79% increase from 2025, indicating significant growth potential)
| 年份 | 预测最高价 | 预测平均价格 | 预测最低价 | 涨跌幅 |
|---|---|---|---|---|
| 2025 | 0.00197 | 0.00145 | 0.00118 | 0 |
| 2026 | 0.00209 | 0.00171 | 0.00129 | 18 |
| 2027 | 0.00205 | 0.0019 | 0.00139 | 30 |
| 2028 | 0.00227 | 0.00198 | 0.00129 | 36 |
| 2029 | 0.00308 | 0.00213 | 0.00121 | 46 |
| 2030 | 0.00287 | 0.0026 | 0.00167 | 79 |
IV. TICO Professional Investment Strategy and Risk Management
TICO Investment Methodology
(1) Long-term Holding Strategy
- Suitable for: Long-term investors interested in Web3 gaming
- Operation suggestions:
- Accumulate TICO tokens during market dips
- Stay informed about Funtico platform developments
- Store tokens securely in non-custodial wallets
(2) Active Trading Strategy
- Technical analysis tools:
- Moving Averages: Monitor short-term and long-term trends
- RSI: Identify overbought and oversold conditions
- Key points for swing trading:
- Set clear entry and exit points
- Use stop-loss orders to manage risk
TICO Risk Management Framework
(1) Asset Allocation Principles
- Conservative investors: 1-3% of crypto portfolio
- Aggressive investors: 5-10% of crypto portfolio
- Professional investors: Up to 15% of crypto portfolio
(2) Risk Hedging Solutions
- Diversification: Spread investments across multiple gaming tokens
- Stop-loss orders: Limit potential losses on exchange trades
(3) Secure Storage Solutions
- Hot wallet recommendation: Gate Web3 Wallet
- Cold storage solution: Hardware wallets for long-term holdings
- Security precautions: Use two-factor authentication, avoid sharing private keys
V. Potential Risks and Challenges for TICO
TICO Market Risks
- High volatility: GameFi tokens can experience significant price swings
- Competition: Increasing number of Web3 gaming platforms
- User adoption: Dependent on the success of Funtico's games
TICO Regulatory Risks
- Uncertain regulations: Potential changes in cryptocurrency and gaming laws
- Cross-border compliance: Varying regulations across different jurisdictions
- Token classification: Possible security token designation by regulators
TICO Technical Risks
- Smart contract vulnerabilities: Potential for exploits or bugs
- Scalability issues: Challenges in handling increased user load
- Blockchain network congestion: Potential for high transaction fees and delays
VI. Conclusion and Action Recommendations
TICO Investment Value Assessment
TICO presents an opportunity in the growing Web3 gaming sector but faces significant competition and regulatory uncertainties. Long-term potential exists if Funtico successfully attracts and retains users, while short-term volatility remains a concern.
TICO Investment Recommendations
✅ Beginners: Start with small positions and focus on learning about GameFi ✅ Experienced investors: Consider allocating a portion of gaming portfolio to TICO ✅ Institutional investors: Monitor Funtico's user growth and game releases closely
TICO Trading Participation Methods
- Spot trading: Purchase TICO tokens on Gate.com
- Staking: Participate in any available staking programs on the Funtico platform
- In-game purchases: Use TICO tokens within Funtico's gaming ecosystem
Cryptocurrency investments carry extremely high risks, and this article does not constitute investment advice. Investors should make decisions carefully based on their own risk tolerance and are advised to consult professional financial advisors. Never invest more than you can afford to lose.
FAQ
What crypto will 1000x prediction?
While it's impossible to predict with certainty, emerging projects in AI, DeFi, or metaverse sectors could potentially see massive growth. Always research thoroughly before investing.
Can Coti reach $10?
While ambitious, reaching $10 is possible for Coti in the long term with significant adoption and market growth. However, it would require substantial increases in market cap and demand.
Can toncoin reach $50?
Yes, Toncoin could potentially reach $50 in the future. While it's a significant increase from current levels, crypto markets are known for their volatility and rapid growth. Factors like increased adoption, network upgrades, and overall market trends could drive Toncoin's price upwards.
Does Coti have potential?
Yes, Coti has significant potential. Its innovative payment solutions and partnerships in the crypto space position it well for future growth and adoption in the evolving digital economy.
Share
Content
Introduction: TICO's Market Position and Investment Value
I. TICO Price History Review and Current Market Status
II. Key Factors Affecting TICO's Future Price
III. TICO Price Prediction for 2025-2030
IV. TICO Professional Investment Strategy and Risk Management
V. Potential Risks and Challenges for TICO
VI. Conclusion and Action Recommendations
FAQ

