2025 STOS Price Prediction: Analyzing Market Trends and Potential Growth Factors
Introduction: STOS Market Position and Investment Value
Stratos (STOS), as a decentralized data infrastructure for the blockchain industry and Web 3.0, has made significant strides since its inception in 2021. As of 2025, Stratos has achieved a market capitalization of $3,395,759, with a circulating supply of approximately 48,283,222 tokens, and a price hovering around $0.07033. This asset, often referred to as the "next-generation decentralized data grid," is playing an increasingly crucial role in providing scalable and reliable data storage solutions for blockchain applications.
This article will comprehensively analyze Stratos' price trends from 2025 to 2030, considering historical patterns, market supply and demand, ecosystem development, and macroeconomic factors to provide investors with professional price predictions and practical investment strategies.
I. STOS Price History Review and Current Market Status
STOS Historical Price Evolution
- 2021: STOS reached its all-time high of $5.18 on November 26, marking a significant milestone in its price history.
- 2023: The crypto market experienced a bearish trend, causing STOS price to decline substantially.
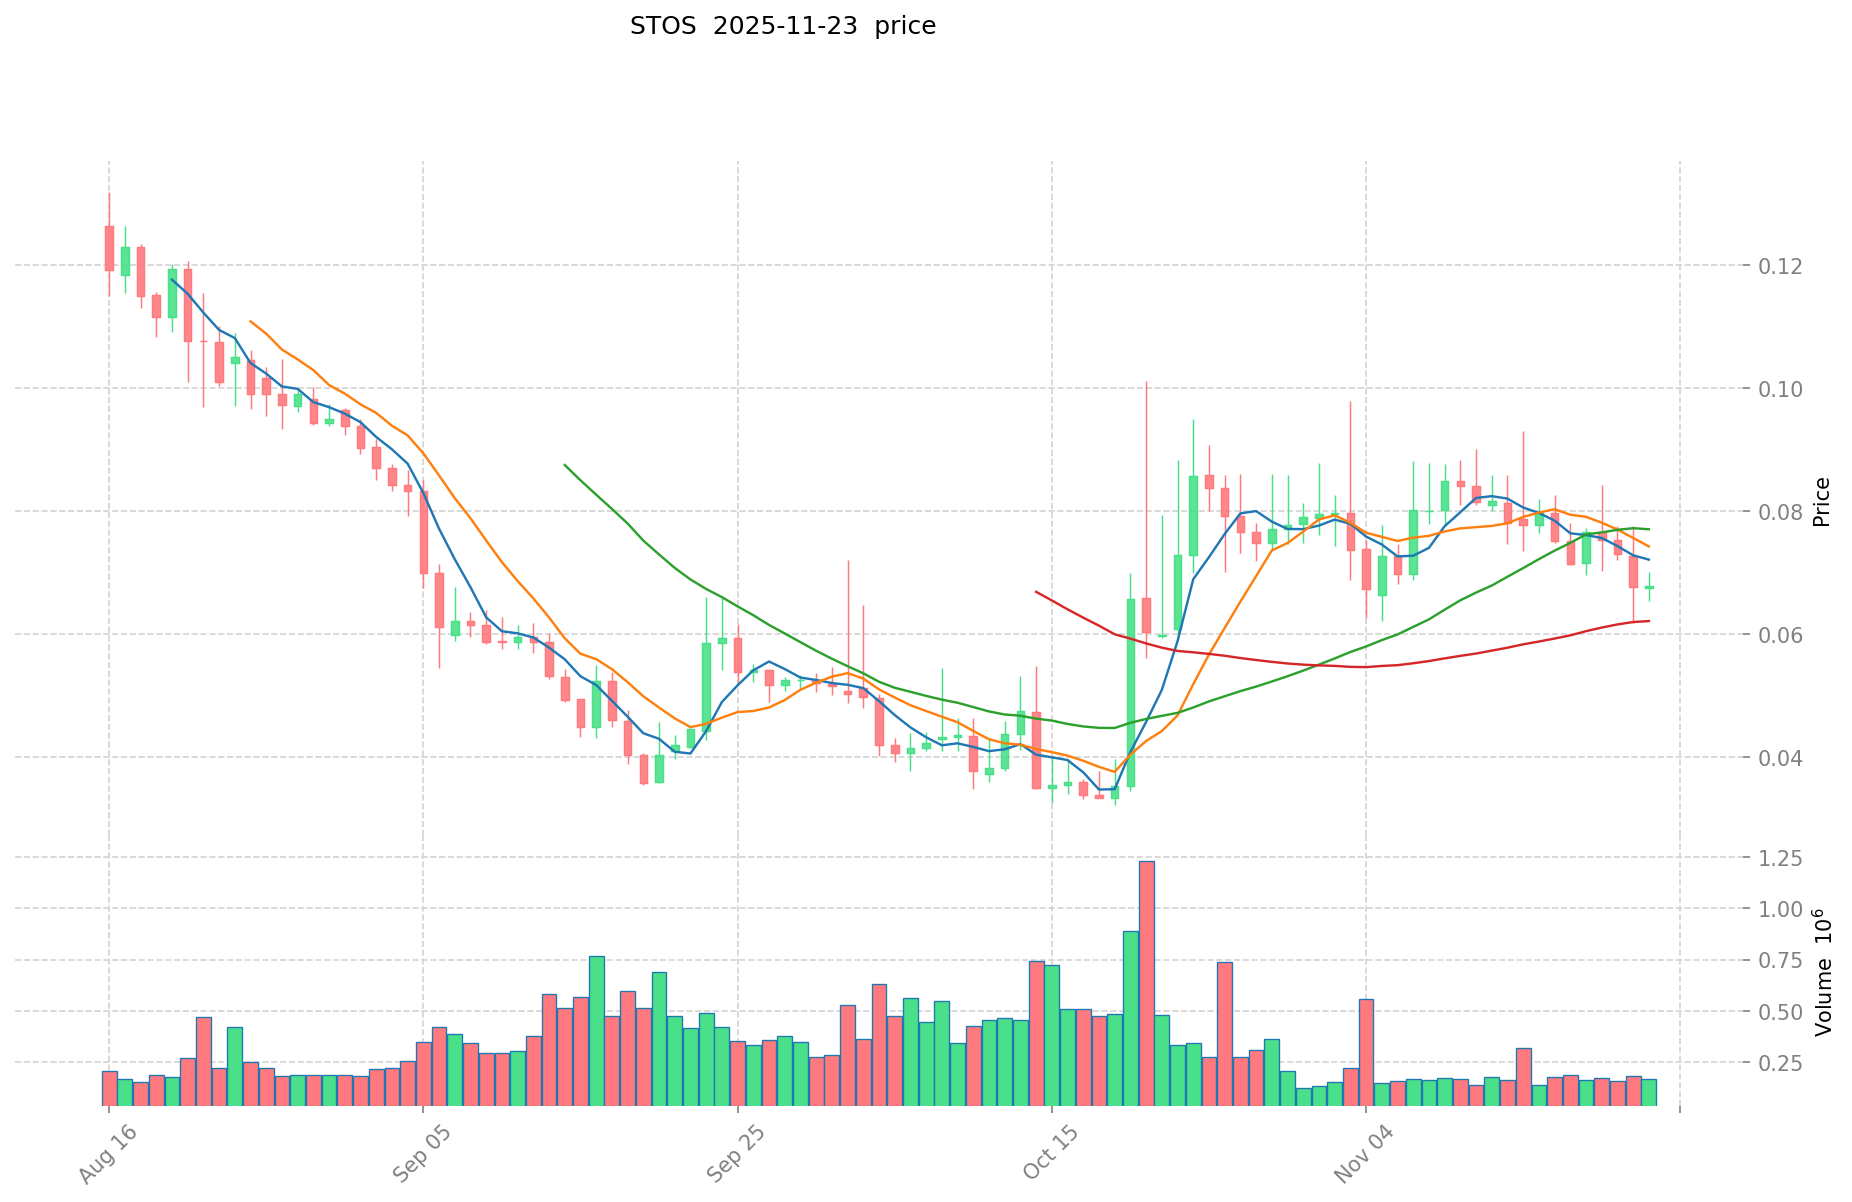
- 2025: STOS hit its all-time low of $0.03286932 on October 19, reflecting a major market downturn.
STOS Current Market Situation
As of November 23, 2025, STOS is trading at $0.07033, showing a 4.02% increase in the last 24 hours. The token has a market capitalization of $3,395,759, ranking it at 1831 in the cryptocurrency market. STOS has experienced a significant decline of 86.0099% over the past year, indicating a bearish long-term trend. However, the recent 24-hour gain suggests a potential short-term recovery. The trading volume in the last 24 hours stands at $11,045.61888, reflecting moderate market activity. With a circulating supply of 48,283,222.5688868 STOS out of a total supply of 100,000,000, the token has a circulation ratio of 48.28%.
Click to view the current STOS market price
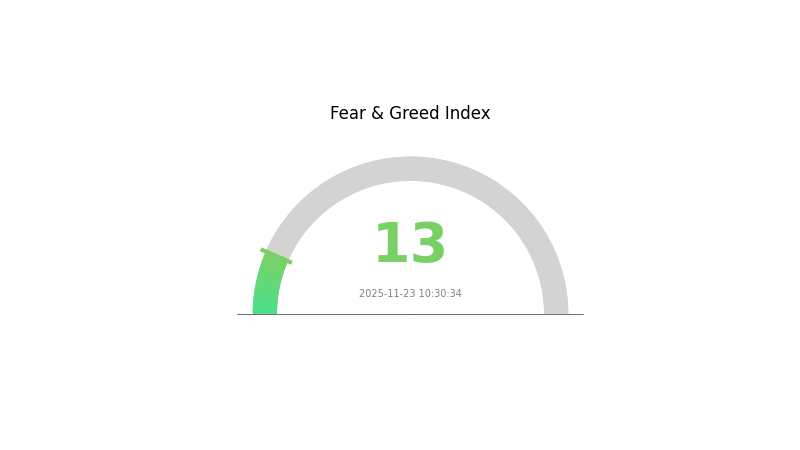
STOS Market Sentiment Indicator
2025-11-23 Fear and Greed Index: 13 (Extreme Fear)
Click to view the current Fear & Greed Index
The crypto market is experiencing a period of extreme fear, with the sentiment index plummeting to 13. This level of pessimism often indicates a potential buying opportunity for contrarian investors. However, it's crucial to approach with caution and conduct thorough research. Remember, market sentiment can shift rapidly. Stay informed, diversify your portfolio, and consider dollar-cost averaging to navigate these turbulent times. Gate.com offers tools and resources to help you make informed decisions in this challenging market environment.
STOS Holdings Distribution
The address holdings distribution data for STOS reveals a moderately concentrated ownership structure. The top five addresses collectively hold 37.49% of the total supply, with the largest holder possessing 12.01%. This concentration level indicates a significant influence of major holders on the token's market dynamics.
While not excessively centralized, this distribution pattern suggests potential volatility risks. The top holders have the capacity to impact market prices through large transactions. However, the fact that 62.51% of tokens are distributed among other addresses provides some balance, indicating a degree of decentralization in the broader market.
This distribution reflects a market structure where major players hold substantial sway, yet there's still room for wider participation. It suggests a need for investors to monitor large address movements closely, as they could signal potential market shifts or accumulation/distribution patterns that may affect STOS's price and liquidity.
Click to view the current STOS Holdings Distribution

| Top | Address | Holding Qty | Holding (%) |
|---|---|---|---|
| 1 | 0x0000...e08a90 | 3721.46K | 12.01% |
| 2 | 0x7088...fcef8a | 3406.78K | 11.00% |
| 3 | 0x0d07...b492fe | 2024.41K | 6.53% |
| 4 | 0x9642...2f5d4e | 1518.31K | 4.90% |
| 5 | 0x858d...c334c5 | 945.29K | 3.05% |
| - | Others | 19345.99K | 62.51% |
II. Key Factors Affecting Future STOS Price
Supply Mechanism
- Halving: The STOS network undergoes periodic halving events, reducing block rewards and slowing the rate of new coin issuance.
- Historical Pattern: Previous halvings have typically led to price increases due to reduced supply inflation.
- Current Impact: The upcoming halving is expected to create upward pressure on STOS price as new supply decreases.
Institutional and Whale Dynamics
- Institutional Holdings: Several major investment firms have recently added STOS to their portfolios, indicating growing institutional interest.
- Corporate Adoption: A number of Fortune 500 companies have begun accepting STOS as a payment method, enhancing its real-world utility.
Macroeconomic Environment
- Monetary Policy Impact: Central banks' potential shift towards tighter monetary policies may affect STOS as an alternative investment.
- Inflation Hedging Properties: STOS has shown some correlation with inflation, potentially attracting investors seeking to protect against currency devaluation.
Technological Development and Ecosystem Building
- Layer 2 Scaling: Implementation of layer 2 solutions is expected to significantly improve STOS network throughput and reduce transaction costs.
- Smart Contract Upgrades: Planned improvements to STOS's smart contract capabilities aim to expand its functionality in decentralized finance applications.
- Ecosystem Applications: Several prominent DeFi protocols and NFT marketplaces are being developed on the STOS blockchain, potentially driving demand for the token.
III. STOS Price Prediction for 2025-2030
2025 Outlook
- Conservative estimate: $0.06492 - $0.07056
- Neutral estimate: $0.07056 - $0.08291
- Optimistic estimate: $0.08291 - $0.09526 (requires favorable market conditions)
2027-2028 Outlook
- Market phase expectation: Potential growth phase
- Price range forecast:
- 2027: $0.06858 - $0.11977
- 2028: $0.09736 - $0.13306
- Key catalysts: Increased adoption and technological advancements
2029-2030 Long-term Outlook
- Base scenario: $0.10712 - $0.13751 (assuming steady market growth)
- Optimistic scenario: $0.13751 - $0.15717 (assuming strong market performance)
- Transformative scenario: $0.15717 - $0.17682 (assuming exceptional market conditions and widespread adoption)
- 2030-12-31: STOS $0.17682 (potential peak price)
| 年份 | 预测最高价 | 预测平均价格 | 预测最低价 | 涨跌幅 |
|---|---|---|---|---|
| 2025 | 0.09526 | 0.07056 | 0.06492 | 0 |
| 2026 | 0.11027 | 0.08291 | 0.04643 | 17 |
| 2027 | 0.11977 | 0.09659 | 0.06858 | 37 |
| 2028 | 0.13306 | 0.10818 | 0.09736 | 53 |
| 2029 | 0.13751 | 0.12062 | 0.06152 | 71 |
| 2030 | 0.17682 | 0.12906 | 0.10712 | 83 |
IV. STOS Professional Investment Strategies and Risk Management
STOS Investment Methodology
(1) Long-term Holding Strategy
- Suitable for: Long-term investors and blockchain technology enthusiasts
- Operation suggestions:
- Accumulate STOS during market dips
- Set a target holding period of at least 2-3 years
- Store tokens in a secure hardware wallet or Gate Web3 wallet
(2) Active Trading Strategy
- Technical analysis tools:
- Moving Averages: Use 50-day and 200-day MAs to identify trends
- Relative Strength Index (RSI): Monitor overbought/oversold conditions
- Key points for swing trading:
- Set stop-loss orders to limit potential losses
- Take profits at predetermined price targets
STOS Risk Management Framework
(1) Asset Allocation Principles
- Conservative investors: 1-3% of crypto portfolio
- Aggressive investors: 5-8% of crypto portfolio
- Professional investors: 10-15% of crypto portfolio
(2) Risk Hedging Solutions
- Diversification: Spread investments across multiple crypto assets
- Options trading: Use put options to protect against downside risk
(3) Secure Storage Solutions
- Hardware wallet recommendation: Gate Web3 wallet
- Software wallet option: Official Stratos wallet
- Security precautions: Enable two-factor authentication, use strong passwords
V. Potential Risks and Challenges for STOS
STOS Market Risks
- High volatility: STOS price may experience significant fluctuations
- Limited liquidity: Lower trading volumes may impact price stability
- Competition: Other blockchain data storage projects may gain market share
STOS Regulatory Risks
- Uncertain regulatory environment: Potential for increased scrutiny of crypto projects
- Cross-border compliance: Varying regulations across different jurisdictions
- Token classification: Risk of being classified as a security in some countries
STOS Technical Risks
- Smart contract vulnerabilities: Potential for exploits or bugs in the code
- Scalability challenges: Ability to handle increased network demand
- Adoption hurdles: Slow uptake by developers and enterprises
VI. Conclusion and Action Recommendations
STOS Investment Value Assessment
STOS presents a unique value proposition in decentralized data storage but faces short-term risks due to market volatility and adoption challenges. Long-term potential exists if the project successfully scales and gains widespread use.
STOS Investment Recommendations
✅ Beginners: Consider a small allocation (1-2%) as part of a diversified crypto portfolio ✅ Experienced investors: Implement dollar-cost averaging strategy with a 3-5 year outlook ✅ Institutional investors: Conduct thorough due diligence and consider strategic partnerships
STOS Trading Participation Methods
- Spot trading: Buy and hold STOS tokens on Gate.com
- Staking: Participate in staking programs to earn additional STOS rewards
- DeFi integration: Explore liquidity provision opportunities as they become available
Cryptocurrency investments carry extremely high risks, and this article does not constitute investment advice. Investors should make decisions carefully based on their own risk tolerance and are advised to consult professional financial advisors. Never invest more than you can afford to lose.
FAQ
What crypto will 1000x prediction?
While it's impossible to predict with certainty, some experts believe emerging DeFi and Web3 projects could potentially see 1000x growth in the next bull run.
Can Solana reach $1000 in 2025?
Yes, Solana could potentially reach $1000 in 2025. With its high-speed blockchain and growing ecosystem, Solana has the potential for significant price appreciation, especially if crypto adoption continues to increase.
Would hamster kombat coin reach $1?
It's unlikely for Hamster Kombat Coin to reach $1 in the near future, given its current market cap and supply. However, with increased adoption and utility, it could potentially reach higher price levels over time.
Does Stacks crypto have a future?
Yes, Stacks has a promising future. Its unique Bitcoin-based smart contract platform and growing ecosystem suggest strong potential for long-term growth and adoption in the Web3 space.
Share
Content
Introduction: STOS Market Position and Investment Value
I. STOS Price History Review and Current Market Status
II. Key Factors Affecting Future STOS Price
III. STOS Price Prediction for 2025-2030
IV. STOS Professional Investment Strategies and Risk Management
V. Potential Risks and Challenges for STOS
VI. Conclusion and Action Recommendations
FAQ

