2025 OVO Price Prediction: Expert Analysis and Market Forecast for the Upcoming Year

Introduction: OVO's Market Position and Investment Value
OVO NFT Platform (OVO) serves as Japan's largest NFT distribution platform, having established itself as a leading one-stop NFT solution provider for high-quality content. Since its inception, OVO has achieved significant milestones, including the sale of over 100,000 NFTs and accumulated more than 150,000 interactions. As of 2026, OVO's market capitalization stands at $74,233.5, with a circulating supply of approximately 165 million tokens, currently trading at $0.0004499 per token. This innovative platform, recognized for its decentralized smart contract infrastructure, is playing an increasingly vital role in the NFT ecosystem and metaverse development.
This article will provide a comprehensive analysis of OVO's price trends through 2031, integrating historical price patterns, market supply and demand dynamics, ecosystem development progress, and macroeconomic factors to deliver professional price forecasts and actionable investment strategies for investors seeking exposure to this emerging NFT platform asset.
OVO NFT Platform Market Analysis Report
I. OVO Price History Review and Market Status
OVO Historical Price Trajectory
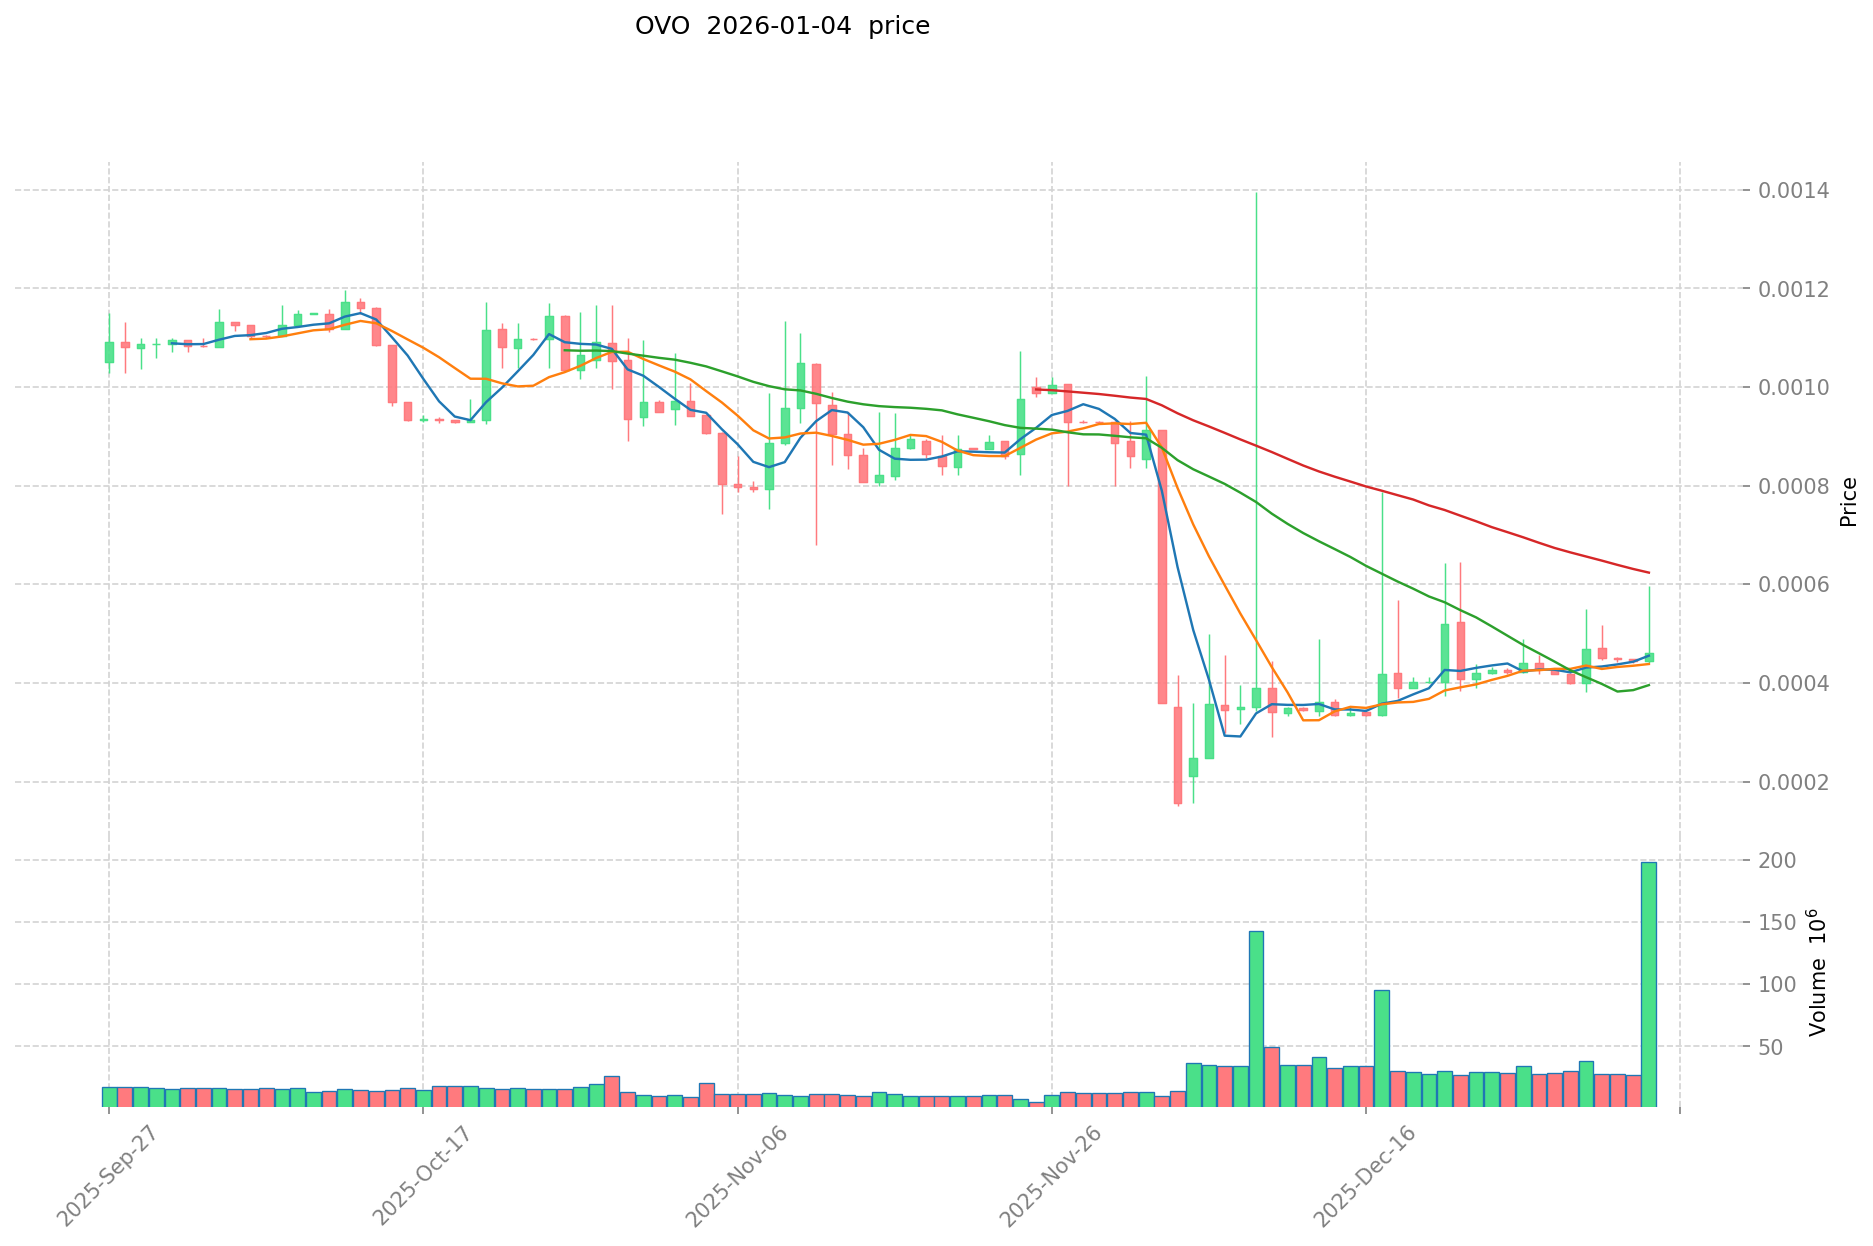
Based on available data, OVO has experienced significant volatility since its inception:
- March 24, 2023: All-Time High (ATH) reached $0.2071, representing the peak valuation of the OVO NFT Platform token during this period.
- January 21, 2025: All-Time Low (ATL) recorded at $0.000036444456381039, marking the lowest price point in OVO's trading history.
- Year-to-Date Performance: OVO has declined 74.31% over the past 12 months, reflecting broader market pressures and project-specific challenges.
OVO Current Market Position
Price and Trading Metrics (As of January 4, 2026):
- Current Price: $0.0004499
- 24-Hour Change: -2.45%
- 7-Day Change: +6.81%
- 30-Day Change: +109.62%
- 1-Hour Change: +0.96%
Market Capitalization and Supply Dynamics:
- Circulating Market Cap: $74,233.50
- Fully Diluted Valuation (FDV): $107,976.00
- Circulating Supply: 165,000,000 OVO
- Total Supply: 240,000,000 OVO
- Maximum Supply: 300,000,000 OVO
- Circulation Ratio: 55%
Trading Activity:
- 24-Hour Trading Volume: $14,449.19
- Market Ranking: 5,244
- Number of Holders: 315
- Market Dominance: 0.0000032%
Price Range (24-Hour):
- 24-Hour High: $0.0005439
- 24-Hour Low: $0.0004431
The OVO NFT Platform token is currently trading near its recent lows, with limited trading volume relative to its market capitalization. The token demonstrates modest short-term recovery momentum over the 30-day period (+109.62%), though this remains significantly below historical valuation levels. The relatively low number of token holders (315) and concentrated market structure suggest a nascent and potentially illiquid market environment.
Click to view current OVO market price
OVO Market Sentiment Indicator
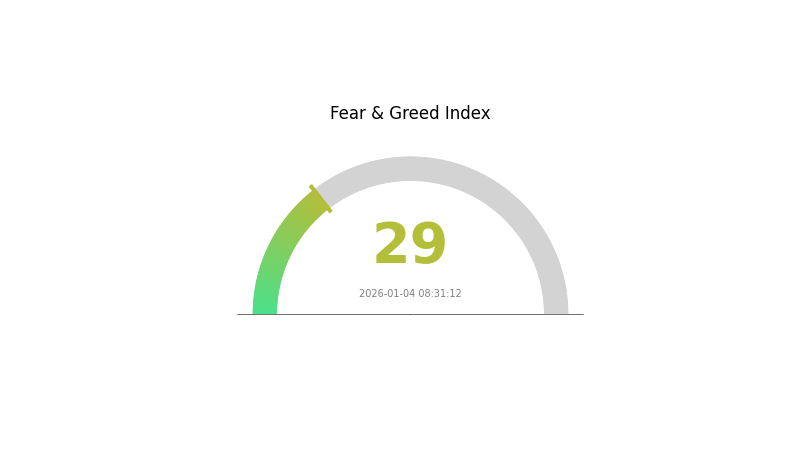
2026-01-04 Fear and Greed Index: 29 (Fear)
Click to view current Fear & Greed Index
Today's cryptocurrency market shows a strong fear sentiment with an index reading of 29. This indicates heightened market anxiety and risk aversion among investors. During such periods, market volatility tends to increase as traders reassess positions and reduce exposure. The fear-dominated environment often presents opportunities for contrarian investors, though caution remains essential. Monitor key support levels closely and consider diversifying your portfolio on Gate.com. Such sentiment extremes historically signal potential market turning points, so stay informed and prepared for potential shifts in market direction.
OVO Holdings Distribution
The address holdings distribution chart illustrates the concentration of token ownership across the blockchain network by displaying the top individual addresses and their respective token quantities and percentages. This metric serves as a critical indicator for assessing the decentralization degree and market structure stability of the asset, revealing potential concentration risks and holder behavior patterns.
OVO currently exhibits significant holder concentration, with the top address commanding 60.70% of total supply, representing an extraordinarily elevated level of ownership centralization. The top five addresses collectively control 87.44% of all tokens in circulation, while the remaining addresses account for merely 12.56%. This extreme concentration pattern indicates a highly skewed distribution landscape, where a minimal number of stakeholders possess overwhelming influence over the token's liquidity and market dynamics. Such pronounced centralization raises considerable concerns regarding market stability, as coordinated actions or liquidation events from principal holders could potentially trigger substantial price volatility and market disruption.
The current address distribution structure presents material risks to market integrity and price discovery mechanisms. With the leading address alone holding more than three-fifths of the supply, the market remains vulnerable to potential manipulation, artificial price movements, and liquidity shocks. The highly fragmented secondary tier of holders further compounds this risk, as the top five addresses control decision-making power disproportionately. This concentration pattern reflects limited decentralization and suggests that OVO's on-chain infrastructure stability remains heavily dependent on the risk tolerance and behavioral consistency of a select few principal stakeholders.
View current OVO holdings distribution
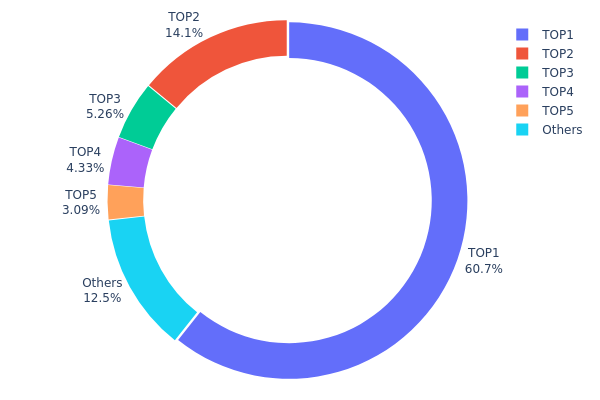
| Top | Address | Holding Qty | Holding (%) |
|---|---|---|---|
| 1 | 0xc4d7...0f5a6f | 100170.45K | 60.70% |
| 2 | 0x7653...58bfc2 | 23210.65K | 14.06% |
| 3 | 0xf26e...06091c | 8679.88K | 5.26% |
| 4 | 0x0d07...b492fe | 7145.59K | 4.33% |
| 5 | 0x6f18...0cc074 | 5100.00K | 3.09% |
| - | Others | 20693.43K | 12.56% |
II. Core Factors Affecting OVO's Future Price
Market Demand and Platform Activity
-
Platform Engagement: OVO's future price is primarily influenced by market demand and platform activity levels. Higher user engagement and transaction volumes on the OVO NFT platform directly correlate with increased demand for the token.
-
Market Competition: Token price trends and competitive positioning within the emerging NFT marketplace ecosystem represent key valuation drivers. OVO's ability to differentiate itself from competing platforms impacts investor sentiment and long-term growth potential.
Institutional Participation and Market Sentiment
-
Institutional Adoption: Investor focus on institutional participation plays a significant role in price movements. Growing institutional interest can drive sustained price appreciation and market stability.
-
Market Sentiment: Investor attention to institutional entry points and macro-economic trends influences OVO's price trajectory. Positive sentiment regarding platform growth prospects attracts both retail and institutional capital.
Technology Innovation and Ecosystem Development
-
Platform Innovation: Continuous technological advancement and feature enhancements drive the platform's competitiveness. Improvements in NFT marketplace functionality and user experience directly support token value appreciation.
-
Ecosystem Growth: Expansion of the OVO ecosystem, including new features and service offerings on the platform, strengthens the foundation for long-term price appreciation and attracts broader market participation.
Three、2026-2031 OVO Price Forecast
2026 Outlook
- Conservative Forecast: $0.00034-$0.00045
- Neutral Forecast: $0.00045
- Bullish Forecast: $0.00057 (requires sustained market demand and positive sentiment)
2027-2028 Mid-term Outlook
- Market Stage Expectation: Consolidation phase with gradual recovery, characterized by moderate volatility and incremental price appreciation as market participants reassess OVO's fundamental value proposition.
- Price Range Forecast:
- 2027: $0.0040-$0.0053
- 2028: $0.0033-$0.0068
- Key Catalysts: Expansion of OVO's utility ecosystem, strategic partnerships, increased adoption on trading platforms such as Gate.com, and positive regulatory developments in key markets.
2029-2031 Long-term Outlook
- Base Case Scenario: $0.0040-$0.0077 (assumes steady market growth and continuous platform development with moderate institutional participation)
- Bullish Scenario: $0.0053-$0.0102 (assumes accelerated ecosystem adoption, significant partnerships, and strong market cycle dynamics)
- Transformational Scenario: $0.0068-$0.0102 (extreme favorable conditions including breakthrough technological innovations, major exchange listings, and substantial capital inflow into the OVO ecosystem)
- 2026-01-04: OVO stands at a pivotal juncture with baseline stability, positioned for potential appreciation through 2031 as market conditions evolve.
| 年份 | 预测最高价 | 预测平均价格 | 预测最低价 | 涨跌幅 |
|---|---|---|---|---|
| 2026 | 0.00057 | 0.00045 | 0.00034 | 0 |
| 2027 | 0.00053 | 0.00051 | 0.0004 | 13 |
| 2028 | 0.00068 | 0.00052 | 0.00033 | 15 |
| 2029 | 0.00077 | 0.0006 | 0.0004 | 33 |
| 2030 | 0.00074 | 0.00068 | 0.00053 | 51 |
| 2031 | 0.00102 | 0.00071 | 0.00045 | 57 |
OVO NFT Platform Investment Strategy and Risk Management Report
IV. OVO Professional Investment Strategy and Risk Management
OVO Investment Methodology
(1) Long-term Holding Strategy
- Target Investors: NFT enthusiasts and platform believers with long-term outlook, content creators seeking stable blockchain-based solutions, and institutional investors interested in emerging Japanese digital asset platforms
- Operation Recommendations:
- Accumulate OVO tokens during market downturns, taking advantage of the 74.31% year-over-year decline to build positions at lower valuations
- Set a 2-3 year holding period to capture potential platform adoption growth as the ecosystem matures and expands its Super Avatar offerings
- Reinvest platform rewards and mining earnings to compound returns through the native ecosystem features
(2) Active Trading Strategy
- Technical Analysis Tools:
- Moving Averages (MA 7/30): Use for identifying trend direction, with current price at $0.0004499 offering reference points for entry and exit signals
- Support and Resistance Levels: Monitor all-time high of $0.20710 and recent low of $0.000036, with intermediate resistance at $0.0005439 (24H high)
- Wave Trading Key Points:
- Capitalize on the 7-day positive momentum (+6.81%) to identify short-term buying opportunities within the broader downtrend
- Set stop losses at 10-15% below entry points given the extreme volatility demonstrated by the 74.31% annual decline and 570x difference between all-time high and low
OVO Risk Management Framework
(1) Asset Allocation Principles
- Conservative Investors: 0.5-1% of total crypto portfolio, emphasizing preservation of capital and minimal exposure to this highly volatile micro-cap asset
- Active Investors: 2-5% of total crypto portfolio, allowing moderate participation in OVO's potential upside while maintaining adequate diversification
- Professional Investors: 5-10% of total crypto portfolio, with sophisticated hedging strategies and deep fundamental analysis to justify elevated exposure
(2) Risk Hedging Solutions
- Stablecoin Reserve Strategy: Maintain 30-40% of allocated capital in stablecoins to enable rapid rebalancing during extreme price volatility or market dislocations
- Diversification Approach: Distribute OVO holdings across multiple entry points and timeframes to reduce timing risk and average purchase costs across market cycles
(3) Secure Storage Solutions
- Hot Wallet Approach: Gate.com Web3 Wallet for active traders conducting frequent transactions within the OVO ecosystem or on decentralized platforms
- Cold Storage Method: Hardware storage solutions for long-term holders planning to hold OVO tokens for extended periods without active trading
- Security Precautions: Never share private keys or seed phrases, enable two-factor authentication on all exchange accounts, regularly verify contract addresses before transactions, and be aware of phishing attempts targeting NFT platform users
V. OVO Potential Risks and Challenges
OVO Market Risk
- Extreme Volatility: With a 74.31% annual decline and price movement from $0.20710 to $0.000036, OVO demonstrates exceptional price instability typical of micro-cap tokens, creating substantial liquidation risk
- Low Trading Liquidity: Daily volume of $14,449.18 is extremely limited for a $107,976 fully diluted market cap, potentially resulting in significant slippage and execution difficulties during large transactions
- Limited Market Adoption: Despite being positioned as Japan's largest NFT platform, only 100,000+ NFTs sold and 315 token holders suggest nascent adoption and concentration risk
OVO Regulatory Risk
- NFT Regulatory Uncertainty: Evolving global regulatory frameworks around digital assets and NFTs create potential compliance challenges that could impact platform operations and token utility
- Geographic Compliance: As a Japan-focused platform, exposure to Japanese financial regulations and potential future crypto asset classification changes could affect token status
- Platform Liability Exposure: Potential regulatory scrutiny of the blind box and mining features could trigger operational modifications or restrictions affecting token economics
OVO Technical Risk
- Smart Contract Vulnerability: Decentralized contract architecture introduces potential security risks, audit failures, or exploitation opportunities that could compromise user assets
- Platform Scalability: Current transaction volume and holder base may face challenges if platform adoption accelerates, potentially causing congestion and degraded user experience
- Integration Risk: Future Super Avatar metaverse integration carries development and execution risks that could delay or diminish the promised value proposition
VI. Conclusions and Action Recommendations
OVO Investment Value Assessment
OVO NFT Platform presents a speculative opportunity in the nascent Japanese NFT market with innovative features including blind boxes, auctions, and mining mechanisms. However, the extreme 74.31% annual price decline, minimal liquidity ($14,449 daily volume), low market capitalization of $107,976, and only 315 token holders indicate a highly illiquid micro-cap asset with significant execution and adoption risks. The platform's fundamental value depends on successful Super Avatar ecosystem expansion and sustained user growth, which remain unproven. Current valuation reflects substantial distress, potentially offering contrarian opportunities for risk-tolerant investors, but also signaling fundamental challenges in market traction or platform viability.
OVO Investment Recommendations
✅ Beginners: Start with minimal position sizing (0.1-0.5% of crypto allocation) for educational purposes only; focus on understanding NFT platforms before committing capital; avoid using leverage or margin trading ✅ Experienced Investors: Conduct deep fundamental research into platform metrics (NFT sales growth, user retention, transaction volume trends); implement strict 10-15% stop losses; only allocate 2-5% of portfolio if conviction is high ✅ Institutional Investors: Require institutional-grade due diligence including smart contract audits, management team verification, and regulatory compliance assessment before participation; consider only as alternative allocation with appropriate risk weighting
OVO Trading Participation Methods
- Gate.com Spot Trading: Direct purchase of OVO tokens using USD, USDT, or other stablecoins with standard market or limit orders
- Gate.com Wallet Management: Transfer OVO to Gate.com Web3 Wallet for self-custody and direct interaction with the OVO ecosystem smart contracts
- Direct Platform Participation: Engage with blind box sales, auction mechanisms, and mining features on the OVO platform directly to earn token rewards while building ecosystem exposure
Cryptocurrency investment carries extreme risk. This report does not constitute investment advice. Investors must make decisions based on individual risk tolerance and are strongly encouraged to consult with professional financial advisors. Never invest more capital than you can afford to lose completely.
FAQ
What is the OVO token price prediction for this year?
Based on a 5% estimated price movement, OVO is projected to experience gradual growth throughout 2026. Market sentiment, regulatory developments, and institutional adoption will significantly influence actual price performance. Predictions are indicative and subject to multiple factors including supply-demand dynamics and macroeconomic trends.
What are the main factors affecting OVO price fluctuations?
OVO price is primarily influenced by supply and demand dynamics, market sentiment driven by news and social media, regulatory developments including policy changes, and institutional adoption rates.
How to conduct OVO price technical analysis and prediction?
Analyze OVO price using technical indicators combined with annual growth rate projections. Short-term predictions fluctuate based on market sentiment and trading volume, while long-term forecasts depend on adoption rates and macroeconomic factors.
How does OVO's investment risk compare to other mainstream cryptocurrencies?
OVO offers moderate risk levels relative to established cryptocurrencies. With growing market adoption and community support, OVO demonstrates competitive volatility patterns. Early-stage tokens typically experience higher price fluctuations, presenting both significant growth potential and trading opportunities for informed investors.
What are OVO's future development prospects and price growth potential?
OVO NFT Platform shows strong growth potential as Japan's largest NFT issuance platform with over 100,000 NFTs sold. Price projections estimate $0.00102-$0.00122 by 2026 and $0.00108-$0.00160 by 2027, driven by expanding digital art, collectibles, and metaverse applications.
What are professional analysts' long-term price predictions for OVO?
Professional analysts predict OVO will experience steady growth over the coming years, with strong potential in the digital payment sector. Long-term outlook remains positive as adoption increases, though specific price targets vary based on market conditions and developments.
Share
Content
Introduction: OVO's Market Position and Investment Value
I. OVO Price History Review and Market Status
II. Core Factors Affecting OVO's Future Price
Three、2026-2031 OVO Price Forecast
IV. OVO Professional Investment Strategy and Risk Management
V. OVO Potential Risks and Challenges
VI. Conclusions and Action Recommendations
FAQ
How to Buy Cryptocurrency


Trending Cryptocurrencies


2025 DOOD Price Prediction: Analyzing Market Trends and Growth Factors for the Coming Bull Run

2025 SKEB Price Prediction: Will This NFT Platform Token Reach New Heights?

2025 SN Price Prediction: Expert Analysis and Market Forecast for the Year Ahead

2025 RIDE Price Prediction: Expert Analysis and Market Forecast for the Year Ahead

2025 SHI Price Prediction: Expert Analysis and Market Forecast for the Coming Year

2025 LUNC Price Prediction: Analyzing Terra Luna Classic's Potential Recovery and Market Outlook in the Post-Crash Era

How to Stake Chainlink: A Step-by-Step Guide to LINK Staking

AlphaArena Model Launch: How AI is Redefining Crypto Trading with Real-World Benchmarks

How to Participate in Chainlink Airdrop

SpaceX Transfers $105 Million in Bitcoin to Unmarked Wallets

Why Do We Celebrate Bitcoin Pizza Day?