2025 NIBI Price Prediction: Analyzing Market Trends and Potential Growth Factors for the Digital Asset
Introduction: NIBI's Market Position and Investment Value
Nibiru Chain (NIBI), as a breakthrough L1 blockchain and smart contract ecosystem, has been providing superior throughput and unparalleled security since its inception. As of 2025, NIBI's market capitalization has reached $2,635,011, with a circulating supply of approximately 186,694,846 tokens, and a price hovering around $0.014114. This asset, hailed as the "developer-friendly Web3 platform," is playing an increasingly crucial role in the field of decentralized applications and smart contracts.
This article will comprehensively analyze NIBI's price trends from 2025 to 2030, combining historical patterns, market supply and demand, ecosystem development, and macroeconomic factors to provide investors with professional price forecasts and practical investment strategies.
I. NIBI Price History Review and Current Market Status
NIBI Historical Price Evolution
- 2024: NIBI reached its all-time high of $1.032 on March 12, 2024
- 2025: NIBI hit its all-time low of $0.008219 on August 14, 2025, a significant drop from its peak
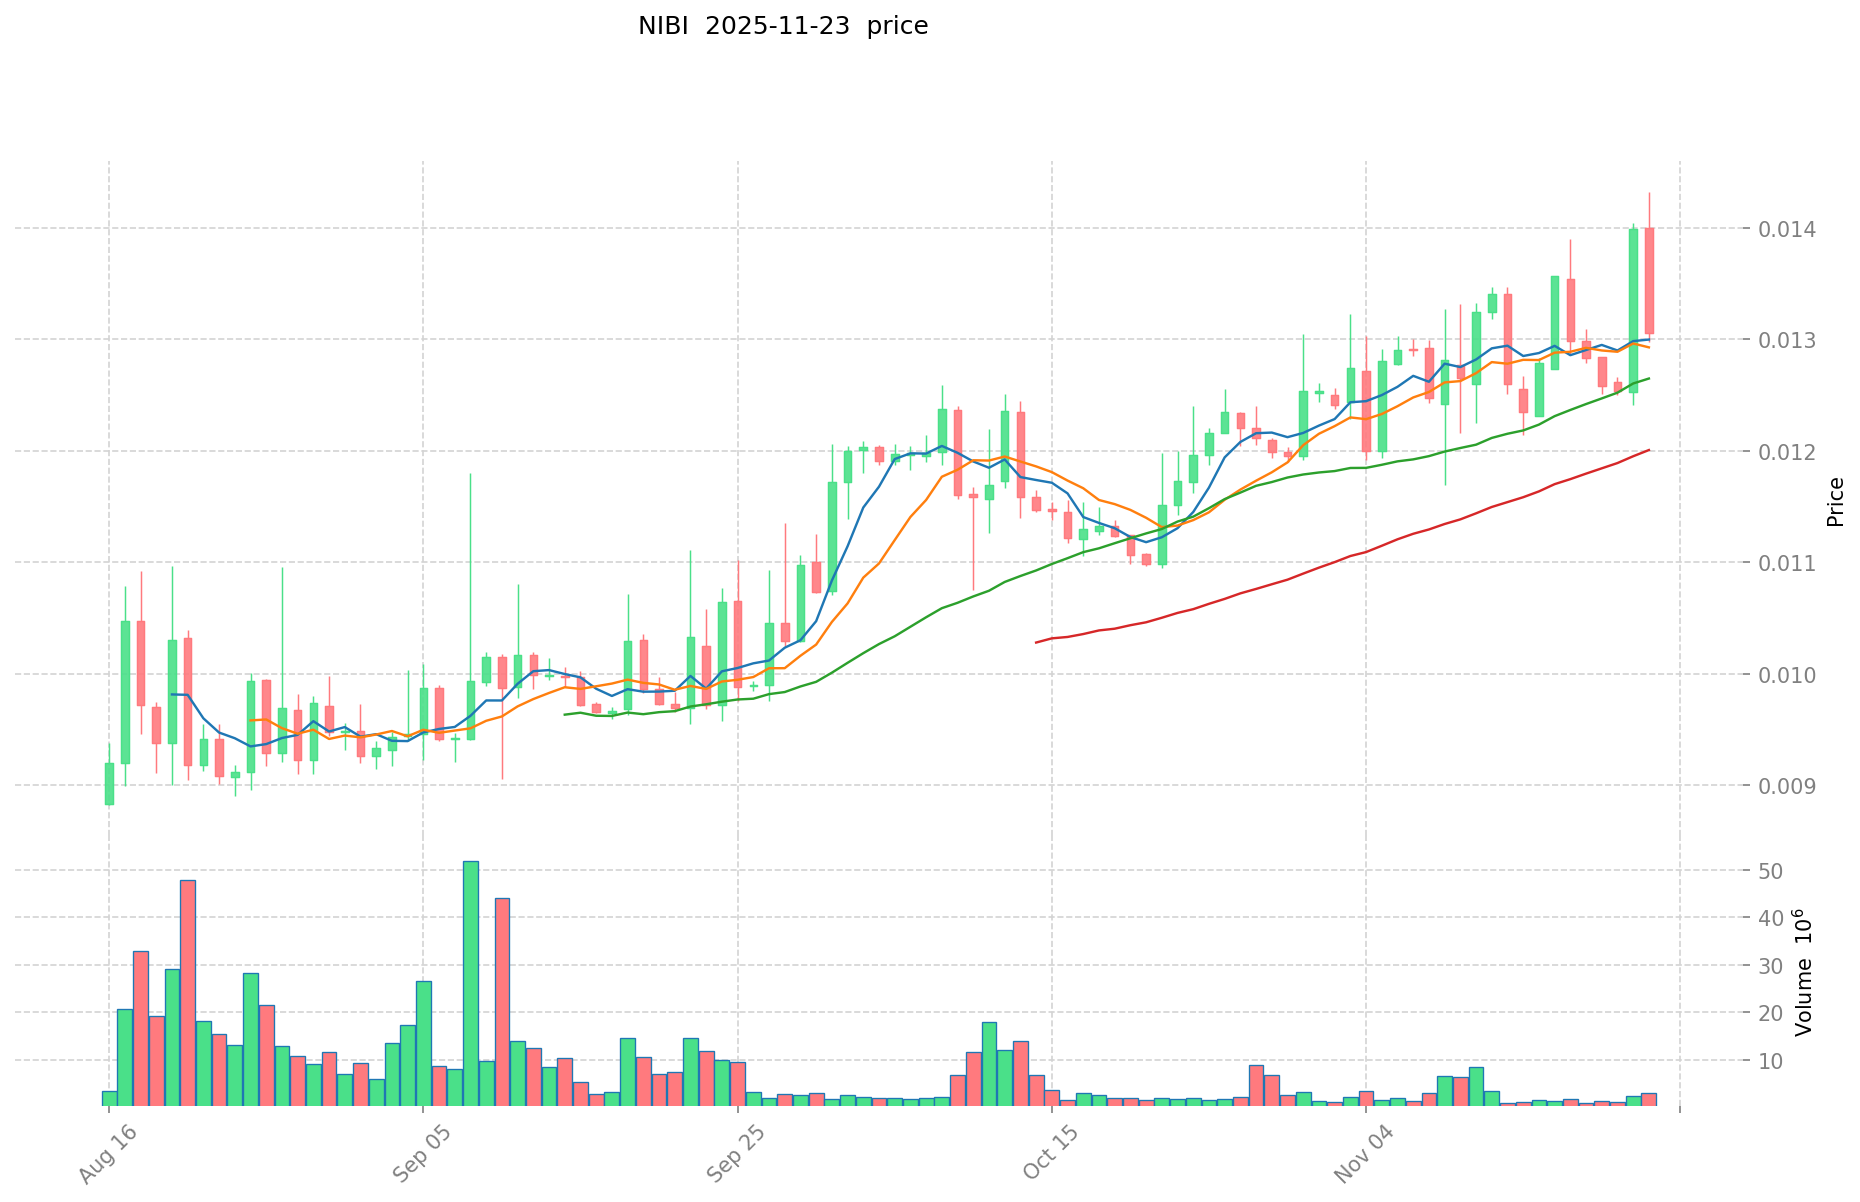
NIBI Current Market Situation
As of November 24, 2025, NIBI is trading at $0.014114. The token has shown a mixed performance across different timeframes. In the past 24 hours, NIBI has experienced a notable increase of 7.36%, with the price ranging between a low of $0.012486 and a high of $0.0144. Over the past week, the token has seen a moderate gain of 3.66%.
Looking at longer-term trends, NIBI has demonstrated strong growth over the past month, with a significant increase of 17.54%. However, the yearly performance paints a different picture, showing a substantial decline of 64.27% compared to the previous year.
The current market capitalization of NIBI stands at $2,635,011, ranking it at 1986 in the overall cryptocurrency market. With a circulating supply of 186,694,846 NIBI tokens, representing 12.45% of the total supply of 1,500,000,000, the project has a fully diluted valuation of $21,171,000.
Despite recent gains, NIBI is still trading significantly below its all-time high, indicating potential for recovery but also highlighting the volatility in the market.
Click to view the current NIBI market price
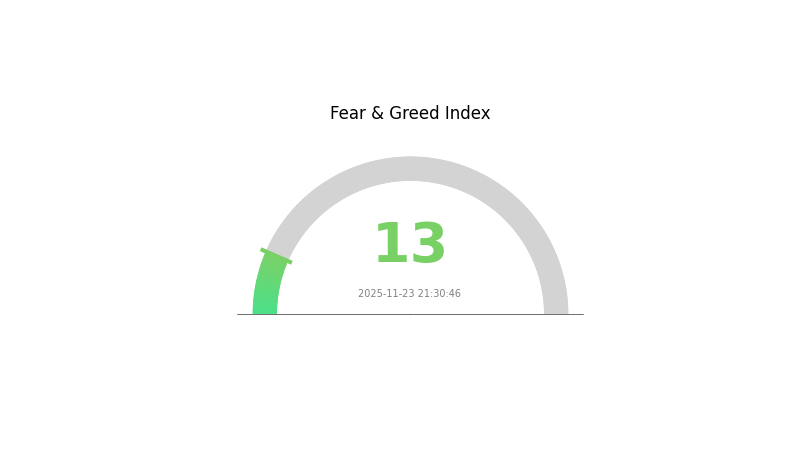
NIBI Market Sentiment Indicator
2025-11-23 Fear and Greed Index: 13 (Extreme Fear)
Click to view the current Fear & Greed Index
The crypto market is currently experiencing extreme fear, with the sentiment index at a low of 13. This level of pessimism often indicates a potential buying opportunity for contrarian investors. However, it's crucial to exercise caution and conduct thorough research before making any investment decisions. Remember, market sentiment can shift rapidly, and past performance doesn't guarantee future results. Stay informed and consider diversifying your portfolio to manage risk effectively.
NIBI Address Distribution
The address distribution chart for NIBI reveals a notable absence of significant token concentrations among individual addresses. This pattern suggests a relatively decentralized distribution of NIBI tokens across the network.
The lack of large token holders, often referred to as "whales," indicates a reduced risk of market manipulation through large sell-offs or coordinated actions. This distribution structure potentially contributes to a more stable price dynamic for NIBI, as it minimizes the impact of individual actors on the overall market.
Furthermore, the current address distribution reflects a higher degree of decentralization within the NIBI ecosystem. This characteristic aligns with the principles of blockchain technology, potentially fostering a more robust and resilient network structure. However, it's important to note that while this distribution appears favorable for market stability, it should be continually monitored as token economies can evolve over time.
Click to view the current NIBI Address Distribution

| Top | Address | Holding Qty | Holding (%) |
|---|
II. Key Factors Affecting NIBI's Future Price
Macroeconomic Environment
- Inflation Hedging Properties: As a cryptocurrency, NIBI may potentially serve as a hedge against inflation in certain economic conditions. However, its effectiveness as an inflation hedge would depend on various factors and market dynamics.
Technical Development and Ecosystem Building
- Ecosystem Applications: The development of DApps and ecosystem projects built on NIBI's blockchain could significantly impact its value and adoption. The growth of a robust ecosystem would likely have a positive influence on NIBI's price.
III. NIBI Price Prediction for 2025-2030
2025 Outlook
- Conservative forecast: $0.01088 - $0.01412
- Neutral forecast: $0.01412 - $0.01730
- Optimistic forecast: $0.01730 - $0.02048 (requires positive market sentiment and increased adoption)
2027-2028 Outlook
- Market phase expectation: Potential growth phase with increased volatility
- Price range forecast:
- 2027: $0.01706 - $0.02188
- 2028: $0.01657 - $0.03062
- Key catalysts: Technological advancements, expanding use cases, and overall crypto market trends
2029-2030 Long-term Outlook
- Base scenario: $0.02270 - $0.02851 (assuming steady market growth and adoption)
- Optimistic scenario: $0.02851 - $0.03962 (assuming accelerated adoption and favorable market conditions)
- Transformative scenario: $0.03962 - $0.04500 (assuming breakthrough applications and mainstream integration)
- 2030-11-24: NIBI $0.02851 (101% increase from 2025, indicating significant long-term growth potential)
| 年份 | 预测最高价 | 预测平均价格 | 预测最低价 | 涨跌幅 |
|---|---|---|---|---|
| 2025 | 0.02048 | 0.01412 | 0.01088 | 0 |
| 2026 | 0.02284 | 0.0173 | 0.01574 | 22 |
| 2027 | 0.02188 | 0.02007 | 0.01706 | 42 |
| 2028 | 0.03062 | 0.02097 | 0.01657 | 48 |
| 2029 | 0.03121 | 0.0258 | 0.0227 | 82 |
| 2030 | 0.03962 | 0.02851 | 0.02081 | 101 |
IV. NIBI Professional Investment Strategies and Risk Management
NIBI Investment Methodology
(1) Long-term Holding Strategy
- Suitable for: Patient investors with a high risk tolerance
- Operation suggestions:
- Accumulate NIBI during market dips
- Set price alerts for significant price movements
- Store NIBI in a secure hardware wallet
(2) Active Trading Strategy
- Technical analysis tools:
- Moving Averages: Use to identify trends and support/resistance levels
- RSI (Relative Strength Index): Monitor overbought/oversold conditions
- Key points for swing trading:
- Set strict stop-loss orders to limit potential losses
- Take profits at predetermined price targets
NIBI Risk Management Framework
(1) Asset Allocation Principles
- Conservative investors: 1-3% of portfolio
- Aggressive investors: 5-10% of portfolio
- Professional investors: 10-15% of portfolio
(2) Risk Hedging Solutions
- Diversification: Spread investments across multiple cryptocurrencies
- Stop-loss orders: Implement to limit potential losses
(3) Secure Storage Solutions
- Hardware wallet recommendation: Gate Web3 Wallet
- Cold storage option: Paper wallet for long-term holdings
- Security precautions: Enable two-factor authentication, use strong passwords
V. NIBI Potential Risks and Challenges
NIBI Market Risks
- High volatility: Significant price fluctuations common in cryptocurrency markets
- Limited liquidity: May impact ability to execute large trades
- Market sentiment: Susceptible to rapid shifts based on news and trends
NIBI Regulatory Risks
- Unclear regulations: Potential for sudden regulatory changes affecting NIBI
- Cross-border restrictions: Varying legal status in different jurisdictions
- Compliance requirements: Possible increased KYC/AML measures
NIBI Technical Risks
- Smart contract vulnerabilities: Potential for exploits or bugs in the code
- Network congestion: Possible transaction delays during high-volume periods
- Technological obsolescence: Risk of being outpaced by newer blockchain technologies
VI. Conclusion and Action Recommendations
NIBI Investment Value Assessment
NIBI presents a high-risk, high-reward opportunity in the L1 blockchain space. Its focus on developer-friendliness and scalability offers long-term potential, but short-term volatility and regulatory uncertainties pose significant risks.
NIBI Investment Recommendations
✅ Beginners: Start with small, regular investments to understand market dynamics ✅ Experienced investors: Consider allocating a portion of portfolio based on risk tolerance ✅ Institutional investors: Conduct thorough due diligence and consider OTC options for large positions
NIBI Trading Participation Methods
- Spot trading: Buy and sell NIBI on Gate.com
- Staking: Participate in staking programs if available to earn passive income
- DeFi integration: Explore decentralized finance options within the Nibiru ecosystem
Cryptocurrency investments carry extremely high risks, and this article does not constitute investment advice. Investors should make decisions based on their own risk tolerance and are advised to consult professional financial advisors. Never invest more than you can afford to lose.
FAQ
Can neiro coin reach $1?
While it's difficult to predict with certainty, reaching $1 is possible for Neiro coin if it gains significant adoption and market interest. However, this would require substantial growth from its current price.
What is Nibi Crypto?
Nibi Crypto is a digital asset designed for decentralized finance. It aims to provide fast, secure transactions and innovative DeFi solutions on its blockchain platform.
How much will 1 pi be worth in 2025?
Based on current market trends and potential growth, 1 pi could be worth around $0.50 to $1 in 2025. However, cryptocurrency prices are highly volatile and subject to many factors.
Will pi coin reach $100?
It's highly unlikely for Pi coin to reach $100. Given its large supply and current market trends, a more realistic long-term price target might be in the range of $0.01 to $1.
Share
Content
Introduction: NIBI's Market Position and Investment Value
I. NIBI Price History Review and Current Market Status
II. Key Factors Affecting NIBI's Future Price
III. NIBI Price Prediction for 2025-2030
IV. NIBI Professional Investment Strategies and Risk Management
V. NIBI Potential Risks and Challenges
VI. Conclusion and Action Recommendations
FAQ

