2025 J Price Prediction: Analyzing Market Trends and Economic Factors Shaping Future Values
Introduction: J's Market Position and Investment Value
Jambo (J), as a project committed to building the world's largest mobile-first crypto network, has made significant strides since its inception. As of 2025, Jambo's market capitalization stands at $4,591,600, with a circulating supply of approximately 130,000,000 tokens, and a price hovering around $0.03532. This asset, known for its focus on mobile crypto solutions, is playing an increasingly crucial role in the mobile-first cryptocurrency ecosystem.
This article will provide a comprehensive analysis of Jambo's price trends from 2025 to 2030, considering historical patterns, market supply and demand, ecosystem development, and macroeconomic factors to offer professional price predictions and practical investment strategies for investors.
I. J Price History Review and Current Market Status
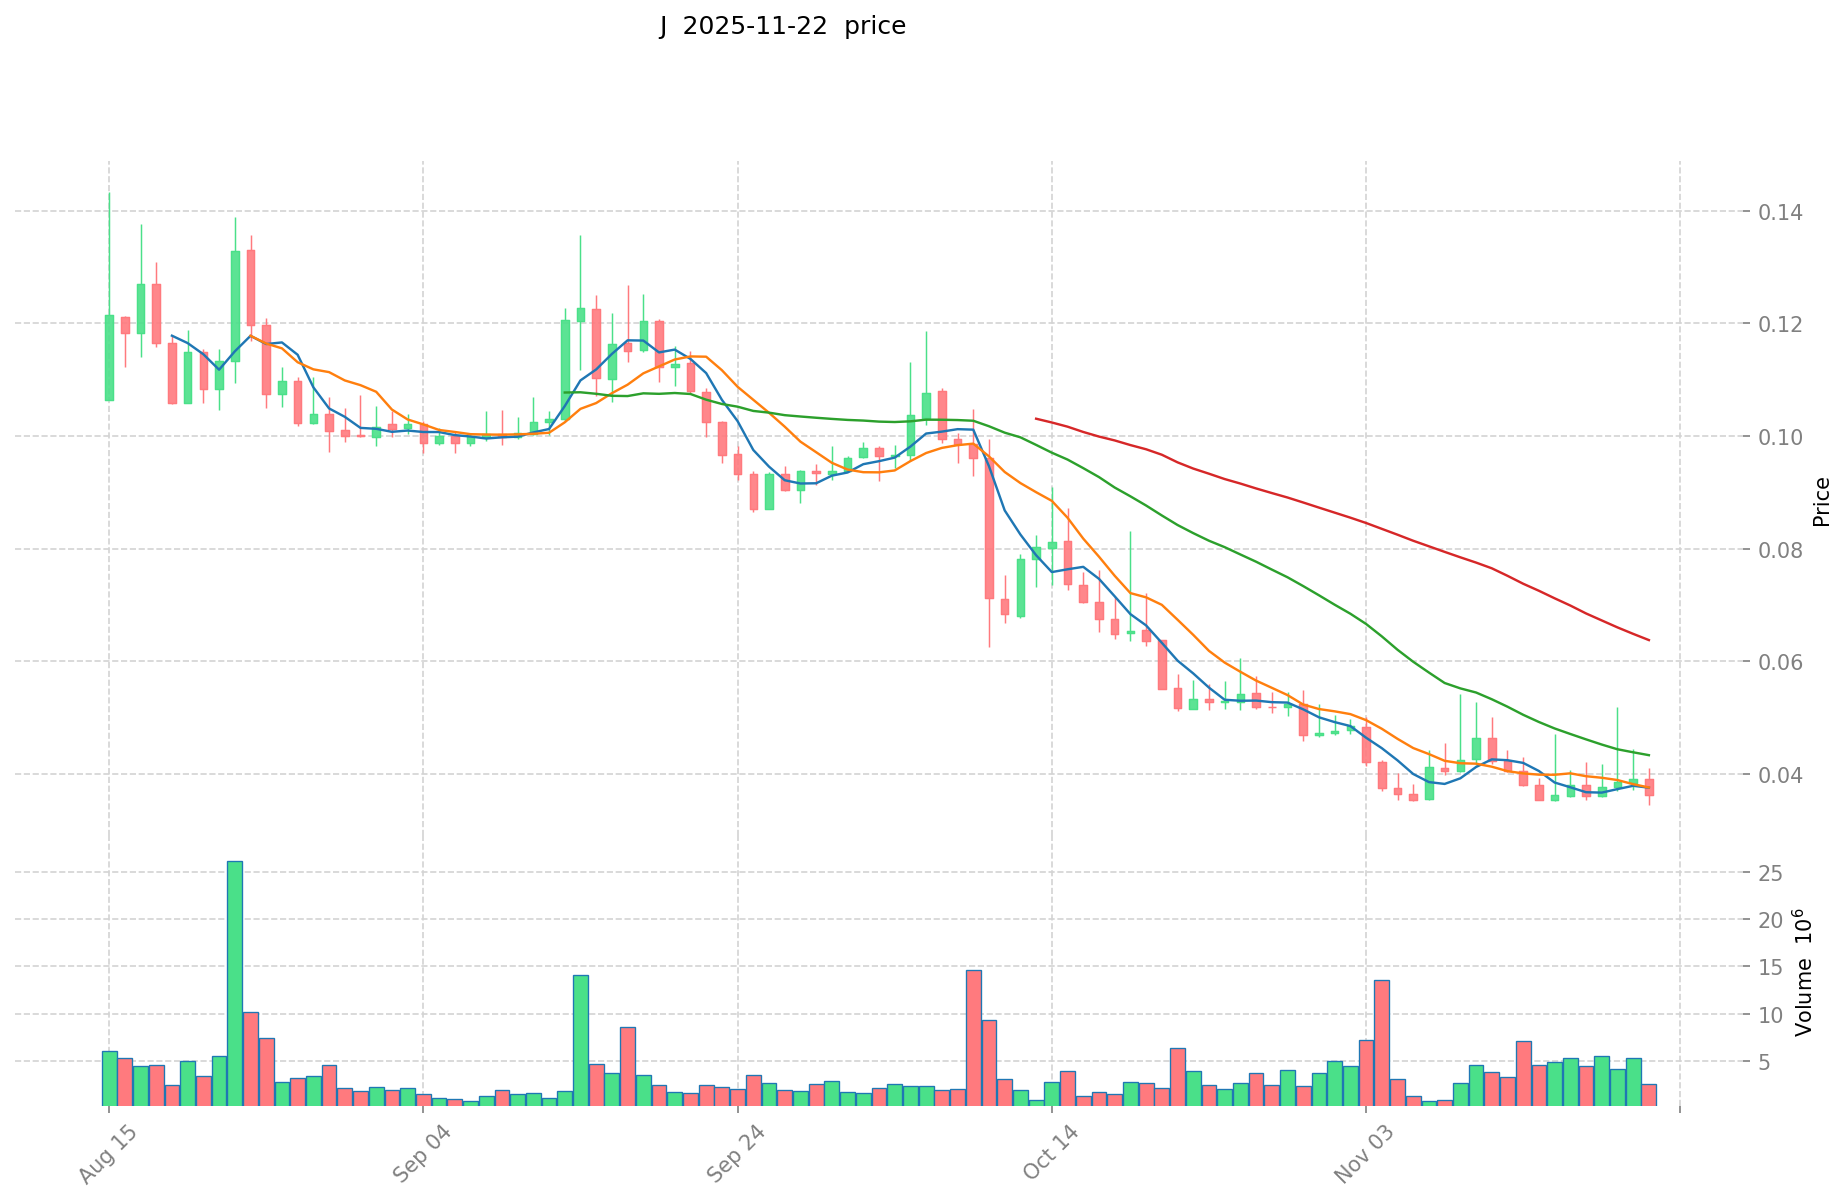
J Historical Price Evolution Trajectory
- 2025 (January): J reached its all-time high of $1.5, marking a significant milestone for the project
- 2025 (November): The market experienced a sharp decline, with J's price dropping to its all-time low of $0.03443
J Current Market Situation
As of November 23, 2025, J is trading at $0.03532, with a 24-hour trading volume of $50,104.95. The token has seen a 2.21% decrease in the last 24 hours. J's market capitalization currently stands at $4,591,600, ranking it at 1615 in the overall cryptocurrency market.
The token has experienced significant volatility in recent periods:
- 1-hour change: +0.22%
- 7-day change: -10.44%
- 30-day change: -34.66%
- 1-year change: -95.072%
These figures indicate a substantial downtrend over the past year, with the token losing over 95% of its value. The current price is significantly below its all-time high of $1.5, achieved in January 2025.
J has a circulating supply of 130,000,000 tokens, which represents 13% of its total supply of 1,000,000,000. The fully diluted market cap is $35,320,000.
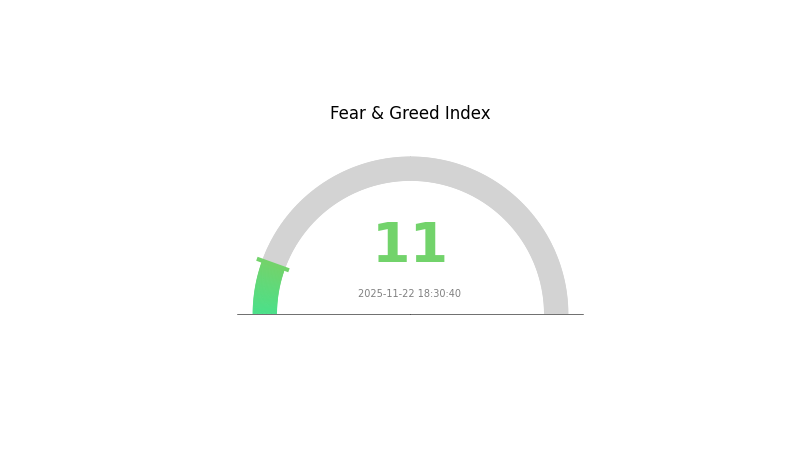
The current market sentiment for cryptocurrencies is described as "Extreme Fear" with a VIX index of 11, suggesting a highly cautious and pessimistic investor outlook.
Click to view the current J market price
J Market Sentiment Indicator
2025-11-22 Fear and Greed Index: 11 (Extreme Fear)
Click to view the current Fear & Greed Index
The crypto market is gripped by extreme fear, with the index plummeting to 11. This level of pessimism often signals a potential buying opportunity for contrarian investors. However, it's crucial to approach with caution and conduct thorough research. Remember, market sentiment can shift rapidly. Stay informed, diversify your portfolio, and consider using tools like stop-loss orders on Gate.com to manage risk in these volatile conditions.
J Holdings Distribution
The address holdings distribution data provides insight into the concentration of J tokens across different wallet addresses. According to the data, the top holder possesses 28.89% of the total supply, while the next four largest holders each control 5% of the tokens. Collectively, the top 5 addresses hold 48.89% of all J tokens, with the remaining 51.11% distributed among other addresses.
This distribution pattern indicates a moderate level of concentration, with nearly half of the tokens controlled by just five addresses. While not excessively centralized, this structure could potentially impact market dynamics. The presence of a single address holding over 28% of the supply may raise concerns about market manipulation or significant price volatility if large transactions occur.
The current distribution suggests a balance between centralized and decentralized token ownership. While there is a notable concentration at the top, the majority of tokens are still held by a broader range of addresses. This structure may provide some stability to the J ecosystem, but investors should remain aware of the potential influence wielded by the largest holders on market movements and governance decisions.
Click to view the current J Holdings Distribution
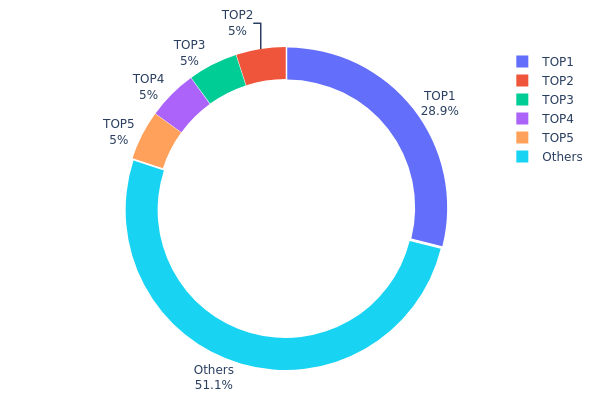
| Top | Address | Holding Qty | Holding (%) |
|---|---|---|---|
| 1 | A5gsRX...Qky4N5 | 288991.99K | 28.89% |
| 2 | 9nESh7...x5smmn | 50000.01K | 5.00% |
| 3 | 3ukaaH...q6QZu1 | 50000.01K | 5.00% |
| 4 | Ftrnwk...wxWori | 50000.01K | 5.00% |
| 5 | 8XcPTZ...y6jrPV | 50000.01K | 5.00% |
| - | Others | 511007.68K | 51.11% |
II. Key Factors Affecting J's Future Price
Supply Mechanism
- Halving: The periodic reduction of block rewards, typically occurring every four years.
- Historical Pattern: Past halvings have generally led to price increases in the long term.
- Current Impact: The next halving is expected to reduce new supply, potentially supporting price growth.
Institutional and Whale Dynamics
- Institutional Holdings: Major financial institutions and corporations have been increasing their J holdings.
- Corporate Adoption: Several Fortune 500 companies have added J to their balance sheets.
- Government Policies: Some countries have recognized J as legal tender, while others are developing regulatory frameworks.
Macroeconomic Environment
- Monetary Policy Impact: Central banks' interest rate decisions and quantitative easing policies affect J's attractiveness as an alternative asset.
- Inflation Hedge Properties: J has shown potential as a hedge against inflation in certain economic conditions.
- Geopolitical Factors: Global economic uncertainties and trade tensions can influence J's perceived value as a safe-haven asset.
Technical Development and Ecosystem Growth
- Lightning Network: Continued development of this layer-2 solution aims to improve J's scalability and transaction speed.
- Taproot Upgrade: This upgrade enhances privacy and smart contract functionality on the J network.
- Ecosystem Applications: Decentralized finance (DeFi) projects and non-fungible token (NFT) platforms are expanding J's utility beyond a store of value.
III. J Price Prediction for 2025-2030
2025 Outlook
- Conservative prediction: $0.02435 - $0.03529
- Neutral prediction: $0.03529 - $0.04288
- Optimistic prediction: $0.04288 - $0.05046 (requires favorable market conditions)
2027 Mid-term Outlook
- Market stage expectation: Potential growth phase
- Price range forecast:
- 2026: $0.02487 - $0.05017
- 2027: $0.0321 - $0.0628
- Key catalysts: Increasing adoption and technological improvements
2030 Long-term Outlook
- Base scenario: $0.05822 - $0.06404 (assuming steady market growth)
- Optimistic scenario: $0.06404 - $0.08261 (assuming strong market performance)
- Transformative scenario: Above $0.08261 (extremely favorable market conditions)
- 2030-11-23: J $0.06404 (81% increase from 2025)
| 年份 | 预测最高价 | 预测平均价格 | 预测最低价 | 涨跌幅 |
|---|---|---|---|---|
| 2025 | 0.05046 | 0.03529 | 0.02435 | 0 |
| 2026 | 0.05017 | 0.04288 | 0.02487 | 21 |
| 2027 | 0.0628 | 0.04652 | 0.0321 | 31 |
| 2028 | 0.06177 | 0.05466 | 0.02897 | 54 |
| 2029 | 0.06986 | 0.05822 | 0.02969 | 64 |
| 2030 | 0.08261 | 0.06404 | 0.03266 | 81 |
IV. Professional Investment Strategies and Risk Management for J
J Investment Methodology
(1) Long-term Holding Strategy
- Suitable for: Patient investors with high risk tolerance
- Operation suggestions:
- Accumulate J tokens during market dips
- Set long-term price targets and stick to the plan
- Store tokens in secure hardware wallets
(2) Active Trading Strategy
- Technical analysis tools:
- Moving Averages: Use to identify trends and potential reversal points
- RSI (Relative Strength Index): Monitor overbought/oversold conditions
- Key points for swing trading:
- Set stop-loss orders to limit potential losses
- Take profits at predetermined resistance levels
J Risk Management Framework
(1) Asset Allocation Principles
- Conservative investors: 1-3%
- Aggressive investors: 5-10%
- Professional investors: 10-15%
(2) Risk Hedging Solutions
- Diversification: Spread investments across multiple cryptocurrencies
- Stop-loss orders: Implement to limit potential losses
(3) Secure Storage Solutions
- Hot wallet recommendation: Gate Web3 wallet
- Cold storage option: Hardware wallets for long-term holdings
- Security precautions: Enable two-factor authentication, use strong passwords
V. Potential Risks and Challenges for J
J Market Risks
- High volatility: J's price can fluctuate dramatically in short periods
- Limited liquidity: May face challenges in executing large trades
- Market sentiment: Susceptible to broader cryptocurrency market trends
J Regulatory Risks
- Uncertain regulatory environment: Potential for unfavorable regulations
- Cross-border compliance: Challenges in adhering to various jurisdictions
- Tax implications: Evolving tax laws may impact investment returns
J Technical Risks
- Smart contract vulnerabilities: Potential for exploits or bugs
- Network congestion: May affect transaction speeds and costs
- Technological obsolescence: Risk of being outpaced by newer projects
VI. Conclusion and Action Recommendations
J Investment Value Assessment
J presents a high-risk, high-potential investment opportunity in the mobile-first crypto network space. While it offers innovative technology, investors should be aware of its significant volatility and regulatory uncertainties.
J Investment Recommendations
✅ Beginners: Consider small, gradual investments to gain exposure ✅ Experienced investors: Implement dollar-cost averaging strategy with strict risk management ✅ Institutional investors: Conduct thorough due diligence and consider as part of a diversified crypto portfolio
J Trading Participation Methods
- Spot trading: Buy and sell J tokens on Gate.com
- Staking: Participate in staking programs if available
- DeFi integration: Explore decentralized finance opportunities involving J tokens
Cryptocurrency investments carry extremely high risks, and this article does not constitute investment advice. Investors should make decisions carefully based on their own risk tolerance and are advised to consult professional financial advisors. Never invest more than you can afford to lose.
FAQ
Is J stock a good investment?
J stock shows potential for growth in the Web3 sector. Its innovative blockchain solutions and increasing market adoption suggest it could be a promising investment for those interested in cryptocurrency markets.
What is the price target for J stock?
Based on current market trends and expert analysis, the price target for J stock is projected to reach $150-$200 by the end of 2026, representing a potential 50-100% increase from current levels.
Is MindMed stock a good buy?
MindMed stock shows potential in the psychedelic medicine sector. With ongoing clinical trials and innovative research, it could be a promising long-term investment for those interested in mental health advancements.
How volatile is J stock?
J stock is highly volatile, with price swings of 10-20% in a day not uncommon. This volatility offers both high risk and potential for significant returns.
Share
Content
Introduction: J's Market Position and Investment Value
I. J Price History Review and Current Market Status
II. Key Factors Affecting J's Future Price
III. J Price Prediction for 2025-2030
IV. Professional Investment Strategies and Risk Management for J
V. Potential Risks and Challenges for J
VI. Conclusion and Action Recommendations
FAQ

