2025 ICE Price Prediction: Expert Analysis and Market Forecast for the Coming Year

Introduction: ICE's Market Position and Investment Value
Ice Open Network (ICE) is a Layer 1 blockchain designed to revolutionize how users and developers interact with Web3 technologies. Since its launch in January 2024, ICE has established itself as a comprehensive decentralized platform offering digital identity verification, social media interaction, content delivery, and secure data storage. As of December 2025, ICE maintains a market capitalization of approximately $16.55 million with a circulating supply of 6.79 billion tokens, currently trading at $0.002437. This innovative blockchain ecosystem, distinguished by its intuitive drag-and-drop dApp builder that democratizes decentralized application development, is playing an increasingly vital role in facilitating broader adoption of blockchain technology.
This article will conduct a comprehensive analysis of ICE's price trajectory from 2025 through 2030, integrating historical price patterns, market supply and demand dynamics, ecosystem development progress, and macroeconomic factors to provide investors with professional price forecasts and practical investment strategies.
Ice Open Network (ICE) Market Analysis Report
I. ICE Price History Review and Market Status
ICE Historical Price Evolution Trajectory
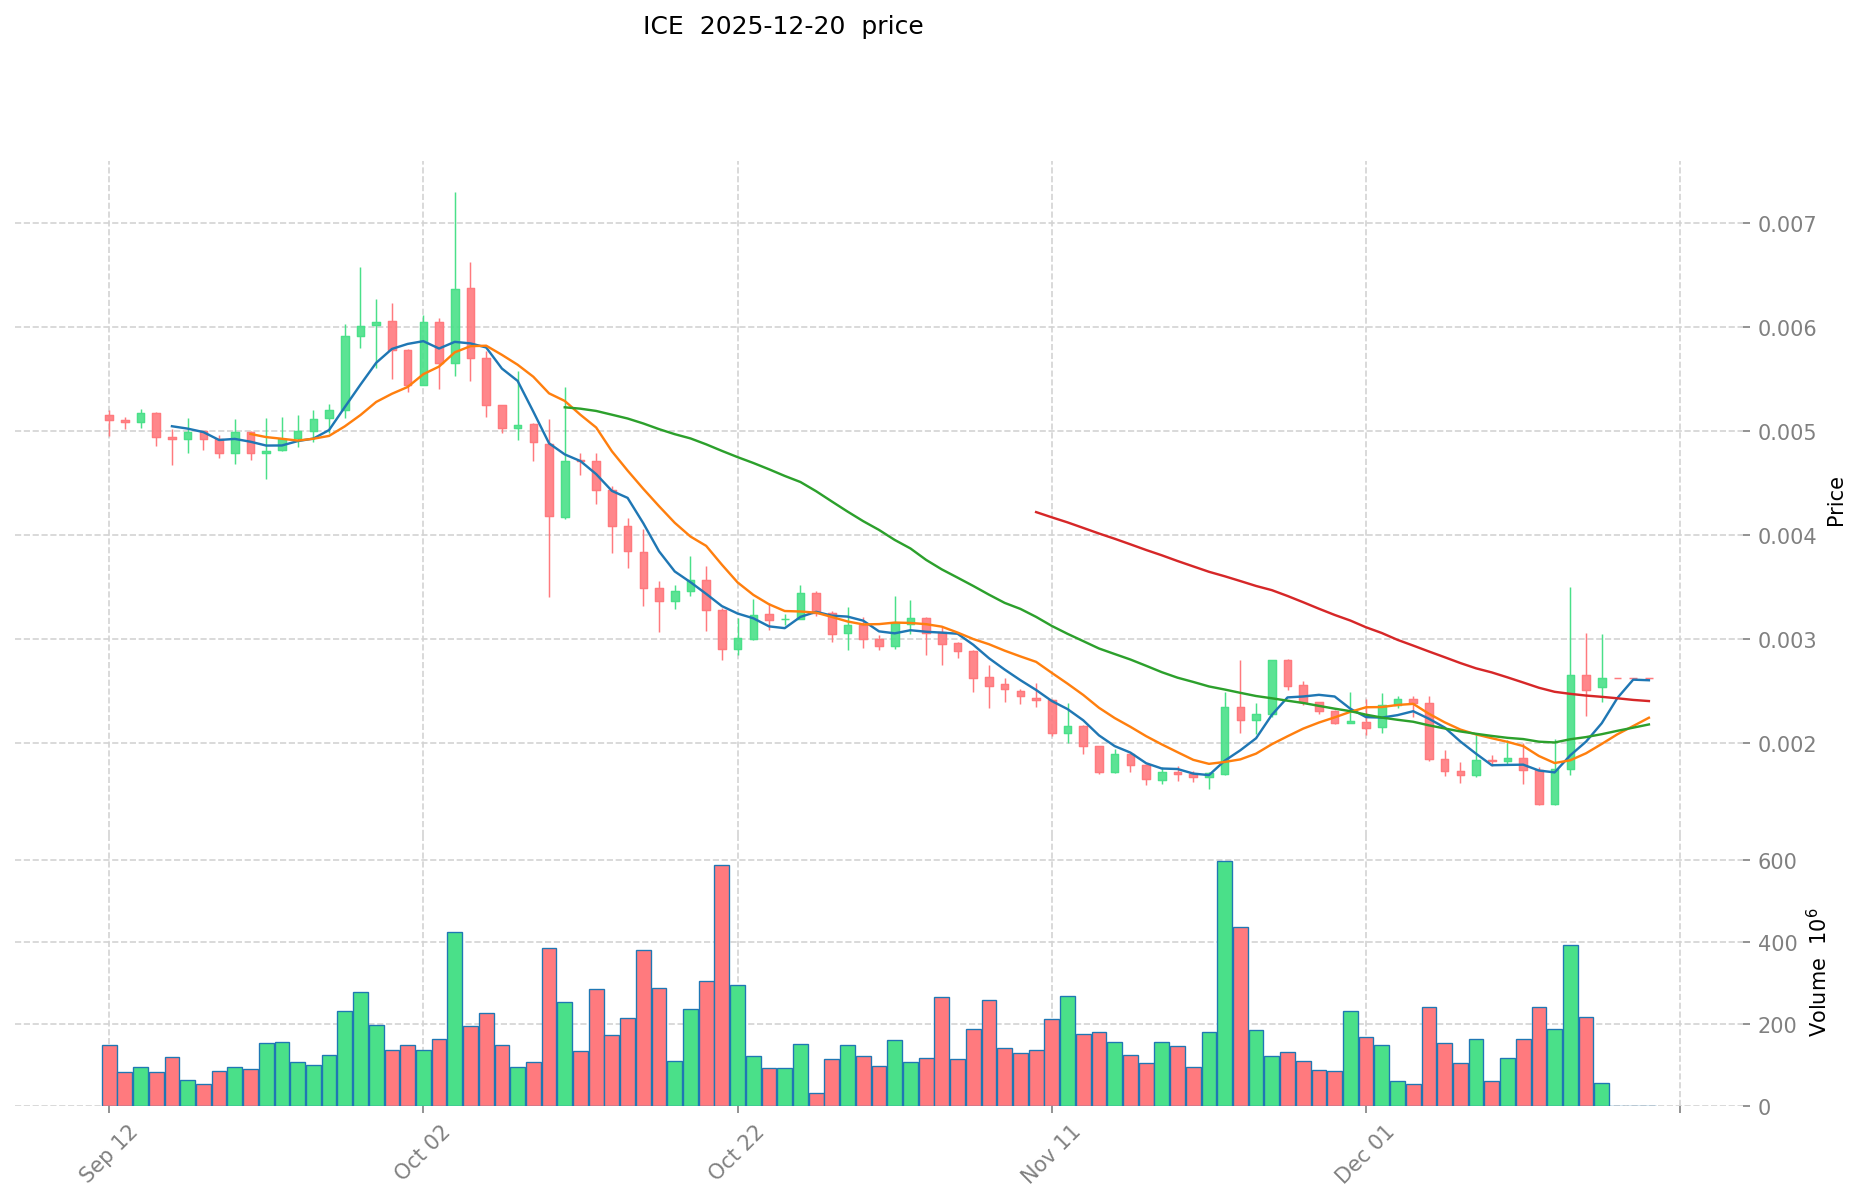
Based on available data, ICE has experienced significant price volatility since its launch:
- January 2024: ICE reached its all-time high (ATH) of $0.15 on January 19, 2024, representing peak market sentiment during the cycle.
- 2024-2025: The token underwent a substantial correction phase, declining approximately 56.69% over the one-year period.
- December 2025: ICE reached its all-time low (ATL) of $0.0014 on December 12, 2025, marking the lowest point in the token's trading history.
ICE Current Market Status
As of December 21, 2025, ICE is trading at $0.002437 with the following market characteristics:
Market Capitalization and Supply Metrics:
- Current Market Cap: $16,554,004.87
- Fully Diluted Valuation (FDV): $51,543,859.73
- Circulating Supply: 6,792,780,005.41 ICE
- Total Supply: 21,150,537,435.26 ICE
- Circulating Supply Ratio: 32.12%
- Market Dominance: 0.0016%
Price Performance:
- 1-hour change: +0.73%
- 24-hour change: 0%
- 7-day change: +37.78%
- 30-day change: +60.31%
- 1-year change: -56.69%
Network Statistics:
- Total Token Holders: 444,052
- Listed on 6 exchanges including Gate.com
- Trading Volume (24h): $0
The token has shown recent recovery momentum, with a 37.78% gain over the past week and a 60.31% increase over the past month, suggesting potential renewed market interest despite the long-term downtrend.
Click to view current ICE market price
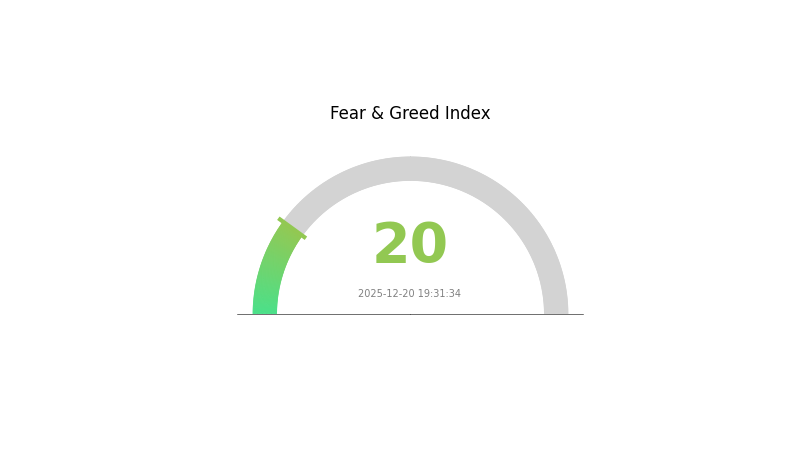
ICE Market Sentiment Index
2025-12-20 Fear and Greed Index: 20 (Extreme Fear)
Click to view current Fear & Greed Index
The cryptocurrency market is experiencing extreme fear sentiment with an index reading of 20. This historically low level signals intense market pessimism and panic selling pressure. During such periods, risk-averse investors typically reduce positions while contrarian traders may identify potential buying opportunities at depressed valuations. Market participants should exercise caution and conduct thorough research before making investment decisions. Monitor on Gate.com for real-time market data and sentiment analysis to better understand current market dynamics.
ICE Holdings Distribution
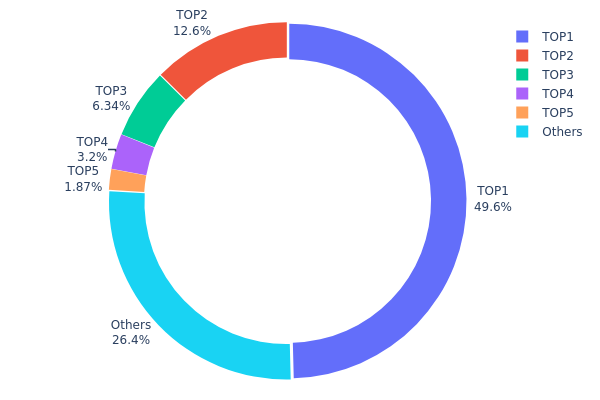
The address holdings distribution chart illustrates the concentration of ICE tokens across the blockchain network by tracking the top holders and their proportional stake in total supply. This metric serves as a critical indicator of token decentralization, market structure vulnerability, and potential manipulation risks within the ecosystem.
ICE demonstrates a pronounced concentration pattern, with the top holder commanding 49.59% of total supply, representing a significant centralization risk. The second-largest holder controls an additional 12.59%, while the third address—identified as a burn address—accounts for 6.33% of tokens permanently removed from circulation. Collectively, the top five addresses control 73.57% of the token supply, indicating substantial wealth concentration among a limited number of stakeholders. This level of concentration raises concerns regarding the token's true decentralization status and governance structure.
The heavily skewed distribution creates notable implications for market dynamics and price stability. With nearly half of all tokens held by a single entity, the potential for coordinated market movements, rapid liquidations, or strategic accumulation exists. The concentration of governance power among few holders could undermine the token's decentralized governance principles. However, the inclusion of a burn address suggests deliberate supply reduction mechanisms have been implemented. The remaining 26.43% distributed among other addresses provides some market resilience, though this represents a minority stake insufficient to significantly counterbalance the dominant holders' influence on market sentiment and price discovery mechanisms.
Click to view the current ICE Holdings Distribution
| Top | Address | Holding Qty | Holding (%) |
|---|---|---|---|
| 1 | 0xeaed...6a6b8d | 10490413.02K | 49.59% |
| 2 | 0x4a04...f95c7f | 2664398.85K | 12.59% |
| 3 | 0x0000...00dead | 1340706.89K | 6.33% |
| 4 | 0x7d8a...46938a | 677486.56K | 3.20% |
| 5 | 0x6443...cecd63 | 394630.96K | 1.86% |
| - | Others | 5582901.15K | 26.43% |
II. Core Factors Influencing ICE's Future Price
Supply Mechanism
- Token Burning: ICE employs a token burning mechanism that gradually reduces the total supply.
- Historical Performance: Historically, token burning has typically driven price increases due to supply contraction.
- Current Impact: The ongoing burn mechanism is expected to continue supporting upward price pressure through reduced circulating supply.
Macroeconomic Environment
- Monetary Policy Impact: Federal Reserve rate cuts of 25 basis points and similar policies influence market liquidity and ICE demand.
- Inflation Hedge Attributes: ICE is increasingly viewed as an inflation hedging tool, particularly given heightened inflation pressures in the United States. The token has the potential to serve as "digital gold" in inflationary environments.
- Geopolitical Factors: Global economic uncertainties and geopolitical tensions may drive demand for alternative assets like ICE.
Three、2025-2030 ICE Price Forecast
2025 Outlook
- Conservative Forecast: $0.00168 - $0.00263
- Neutral Forecast: $0.00263 (average expected level)
- Optimistic Forecast: $0.00344 (requiring sustained market sentiment and positive regulatory developments)
2026-2027 Mid-term Outlook
- Market Stage Expectation: Gradual accumulation phase with increasing institutional interest and ecosystem expansion
- Price Range Forecast:
- 2026: $0.00209 - $0.00361
- 2027: $0.00316 - $0.00365
- Key Catalysts: Ecosystem maturity, partnership announcements, and broader cryptocurrency market adoption
2028-2030 Long-term Outlook
- Base Case Scenario: $0.00227 - $0.00401 (assuming steady adoption and market recovery cycles)
- Optimistic Scenario: $0.00401 - $0.00465 (assuming accelerated enterprise adoption and network growth)
- Transformational Scenario: $0.00575 (extreme favorable conditions including mainstream institutional adoption, significant technological breakthroughs, and macroeconomic tailwinds)
- 2030-12-31: ICE reaches $0.00575 (72% cumulative appreciation from 2025 baseline, representing strong long-term value creation)
| 年份 | 预测最高价 | 预测平均价格 | 预测最低价 | 涨跌幅 |
|---|---|---|---|---|
| 2025 | 0.00344 | 0.00263 | 0.00168 | 7 |
| 2026 | 0.00361 | 0.00303 | 0.00209 | 24 |
| 2027 | 0.00365 | 0.00332 | 0.00316 | 36 |
| 2028 | 0.00401 | 0.00349 | 0.00227 | 43 |
| 2029 | 0.00465 | 0.00375 | 0.0033 | 53 |
| 2030 | 0.00575 | 0.0042 | 0.00227 | 72 |
Ice Open Network (ICE) Professional Investment Strategy and Risk Management Report
IV. ICE Professional Investment Strategy and Risk Management
ICE Investment Methodology
(1) Long-Term Holding Strategy
-
Target Investors: Investors with high risk tolerance seeking exposure to emerging Layer 1 blockchain infrastructure and decentralized service ecosystems.
-
Operational Recommendations:
- Establish a core position during market corrections, targeting accumulation at support levels below $0.003
- Maintain a 12-24 month holding horizon to allow for ecosystem development and potential adoption growth
- Implement dollar-cost averaging (DCA) to reduce timing risk over quarterly investment cycles
-
Storage Solutions:
(2) Active Trading Strategy
-
Technical Analysis Tools:
- Moving Averages (MA 50/200): Use crossovers to identify trend reversals and momentum shifts
- Relative Strength Index (RSI): Trade when RSI falls below 30 (oversold) for entry signals and above 70 (overbought) for exit signals
- Volume Analysis: Confirm breakouts with volume surges exceeding 2x average daily volume
-
Wave Trading Key Points:
- Exploit the 7-day volatility of 37.78% through swing trades with 15-25% profit targets
- Set stop-losses at 8-10% below entry points to manage downside risk
- Monitor BSC network activity for timing entries during low gas fee periods
ICE Risk Management Framework
(1) Asset Allocation Principles
- Conservative Investors: 1-2% portfolio allocation to ICE due to high volatility and early-stage project risk
- Aggressive Investors: 3-5% portfolio allocation with tactical rebalancing every quarter
- Professional Investors: 5-8% allocation as alternative asset class with structured position management
(2) Risk Hedging Strategies
- Volatility Hedging: Use trailing stop-losses set at 12-15% below recent highs to protect against sudden price reversals
- Correlation Diversification: Balance ICE holdings with established Layer 1 tokens to reduce concentration risk within the blockchain infrastructure sector
(3) Secure Storage Solutions
- Hot Wallet Option: Gate Web3 Wallet provides optimal balance of accessibility and security for active traders, with multi-signature support
- Cold Storage Approach: For long-term holdings exceeding 6 months, transfer to self-custody solutions on BSC with regular security audits
- Critical Security Considerations:
- Never share private keys or seed phrases
- Verify contract address (0xc335df7c25b72eec661d5aa32a7c2b7b2a1d1874 on BSC) before transactions
- Enable IP whitelisting on exchange accounts
- Use two-factor authentication universally across all platforms
V. ICE Potential Risks and Challenges
ICE Market Risk
- Extreme Volatility: Year-to-date decline of -56.69% demonstrates significant price instability, with all-time high of $0.15 versus current price of $0.002437, creating substantial drawdown exposure
- Low Trading Liquidity: 24-hour volume of $0 indicates potential difficulty in executing large orders without significant price slippage
- Limited Market Adoption: Market cap of $16.55 million with only 444,052 token holders suggests nascent user base and risk of prolonged liquidity constraints
ICE Regulatory Risk
- Blockchain Regulatory Uncertainty: Evolving global regulatory frameworks for Layer 1 blockchain platforms could impact ION's operational scope and compliance costs
- Jurisdictional Constraints: Changes in cryptocurrency regulations across key markets could limit ION's ability to offer decentralized identity verification and social services
- Token Classification Risk: Regulatory authorities may reclassify ICE token status, affecting its tradability and exchange listing status
ICE Technology Risk
- Unproven Scaling Solution: As an emerging Layer 1 platform, ION faces technical challenges in achieving reliable throughput and transaction finality compared to established networks
- Smart Contract Vulnerability: Early-stage protocols carry elevated risk of code vulnerabilities, exploits, or critical bugs that could result in fund loss
- Ecosystem Dependency: Heavy reliance on third-party integrations for dApp builder functionality creates operational risks if dependency chains fail
VI. Conclusion and Action Recommendations
ICE Investment Value Assessment
Ice Open Network (ICE) presents a high-risk, high-reward opportunity in the Layer 1 blockchain infrastructure space. The project's emphasis on accessible dApp creation and integrated decentralized services addresses genuine adoption barriers. However, significant headwinds exist: a 56.69% year-over-year decline, minimal trading volume, and an underdeveloped ecosystem relative to established competitors. The current valuation, with market cap of $16.55 million and only 32.12% circulating supply ratio, suggests both accumulation opportunity and substantial execution risk. Success depends on rapid ecosystem development, institutional partnerships, and resolution of regulatory uncertainties.
ICE Investment Recommendations
✅ Beginners: Start with micro-allocations (0.5-1% of portfolio) purchased via Gate.com, with automatic stop-losses set at 8% below entry. Use this as a learning position for emerging Layer 1 projects without risking capital preservation.
✅ Experienced Investors: Implement a two-tier strategy: 60% long-term core position with 2-year horizon, and 40% tactical trading using 20-25% profit targets and 10% stop-losses. Rebalance quarterly based on network development milestones.
✅ Institutional Investors: Structure positions through multiple tranches, with initial allocation following Layer 1 fundamental analysis, subsequent increases tied to ecosystem KPI achievement (transaction volume, developer adoption, TVL growth). Utilize options strategies for volatility management.
ICE Trading Participation Methods
- Direct Purchase via Gate.com: Access ICE trading directly on Gate.com's trading platform with BSC blockchain support, utilizing limit orders and dollar-cost averaging features
- Swing Trading: Execute 7-14 day holding periods capitalizing on the 37.78% 7-day volatility for 15-25% return targets
- Liquidity Provision Consideration: Monitor BSC liquidity pools for yield opportunities once ecosystem matures (advanced users only)
Cryptocurrency investment carries extreme risk. This report does not constitute investment advice. Investors must make decisions based on their individual risk tolerance and financial situation. Consult with a professional financial advisor before making significant investment decisions. Never invest more than you can afford to lose completely.
FAQ
Can an ice coin reach $10?
Yes, ICE coin could potentially reach $10 with sufficient adoption, increased trading volume, and positive market sentiment. However, achieving this milestone depends on ecosystem development and overall crypto market conditions.
Is ice a good investment?
ICE demonstrates strong fundamentals as an investment choice, ranking 7th among top stocks for long-term holding. Its consistent market performance and solid position make it an attractive option for investors seeking reliable growth potential.
What is the price target for ice stock?
The price target for ICE ranges from $175.00 to $230.00, with an average target suggesting approximately 21.53% upside potential based on current analyst forecasts.
What is the potential of an ice network?
The ICE Network has strong potential to become a key Web 3.0 player with its sustainable economic model and experienced team. It aims to revolutionize decentralization through innovative technology and community-driven adoption.
Share
Content
Introduction: ICE's Market Position and Investment Value
I. ICE Price History Review and Market Status
II. Core Factors Influencing ICE's Future Price
2025 Outlook
2026-2027 Mid-term Outlook
2028-2030 Long-term Outlook
IV. ICE Professional Investment Strategy and Risk Management
V. ICE Potential Risks and Challenges
VI. Conclusion and Action Recommendations
FAQ
How to Buy Cryptocurrency


Trending Cryptocurrencies


2025 KAIA Price Prediction: Expected Market Trends and Investment Outlook for the Innovative Digital Asset

2025 ALT Price Prediction: Analyzing Market Trends and Potential Growth Factors

What is IKA: A Comprehensive Guide to Understanding International Kinematics and Automation
Fastest Blockchains Ranked by Transactions Per Second

RSS3 vs NEAR: A Comprehensive Comparison of Two Leading Blockchain Platforms for Web3 Infrastructure

ELA vs FLOW: A Comprehensive Comparison of Two Leading Blockchain Layer-2 Solutions

How to Stake Chainlink: A Step-by-Step Guide to LINK Staking

AlphaArena Model Launch: How AI is Redefining Crypto Trading with Real-World Benchmarks

How to Participate in Chainlink Airdrop

SpaceX Transfers $105 Million in Bitcoin to Unmarked Wallets

Why Do We Celebrate Bitcoin Pizza Day?