2025 GMT Fiyat Tahmini: STEPN’in Yerel Token’ı İçin Piyasa Trendleri ve Potansiyel Büyüme Faktörlerinin Analizi


Giriş: GMT’nin Piyasa Konumu ve Yatırım Değeri
STEPN (GMT), kripto para piyasasında önde gelen bir kazan-kazan spor uygulaması olarak, 2022’deki çıkışından bu yana önemli başarılara imza attı. 2025 yılı itibarıyla STEPN’in piyasa değeri 86.528.038 dolar seviyesine ulaştı; dolaşımdaki token miktarı yaklaşık 3.111.400.155 ve fiyatı 0,02781 dolar civarında seyrediyor. “Web3 Fitness Pioneer” olarak anılan bu varlık, fitness, blokzincir teknolojisi ve dijital varlık yönetiminin kesişim noktasında giderek daha önemli bir rol oynuyor.
Bu makale, STEPN’in 2025-2030 yılları arasındaki fiyat hareketlerini kapsamlı şekilde analiz edecek; tarihsel trendler, piyasa arz ve talebi, ekosistem gelişimi ile makroekonomik faktörler göz önüne alınarak yatırımcılara profesyonel fiyat tahminleri ve uygulanabilir yatırım stratejileri sunulacak.
I. GMT Fiyat Geçmişi ve Güncel Piyasa Durumu
GMT Tarihsel Fiyat Gelişimi
- 2022: STEPN’in çıkışı, 28 Nisan’da tüm zamanların en yüksek seviyesi olan 4,11 dolara ulaştı
- 2023: Piyasa gerilemesi, fiyat ciddi şekilde düştü
- 2024: Kademeli piyasa toparlanması, fiyat denge sinyalleri verdi
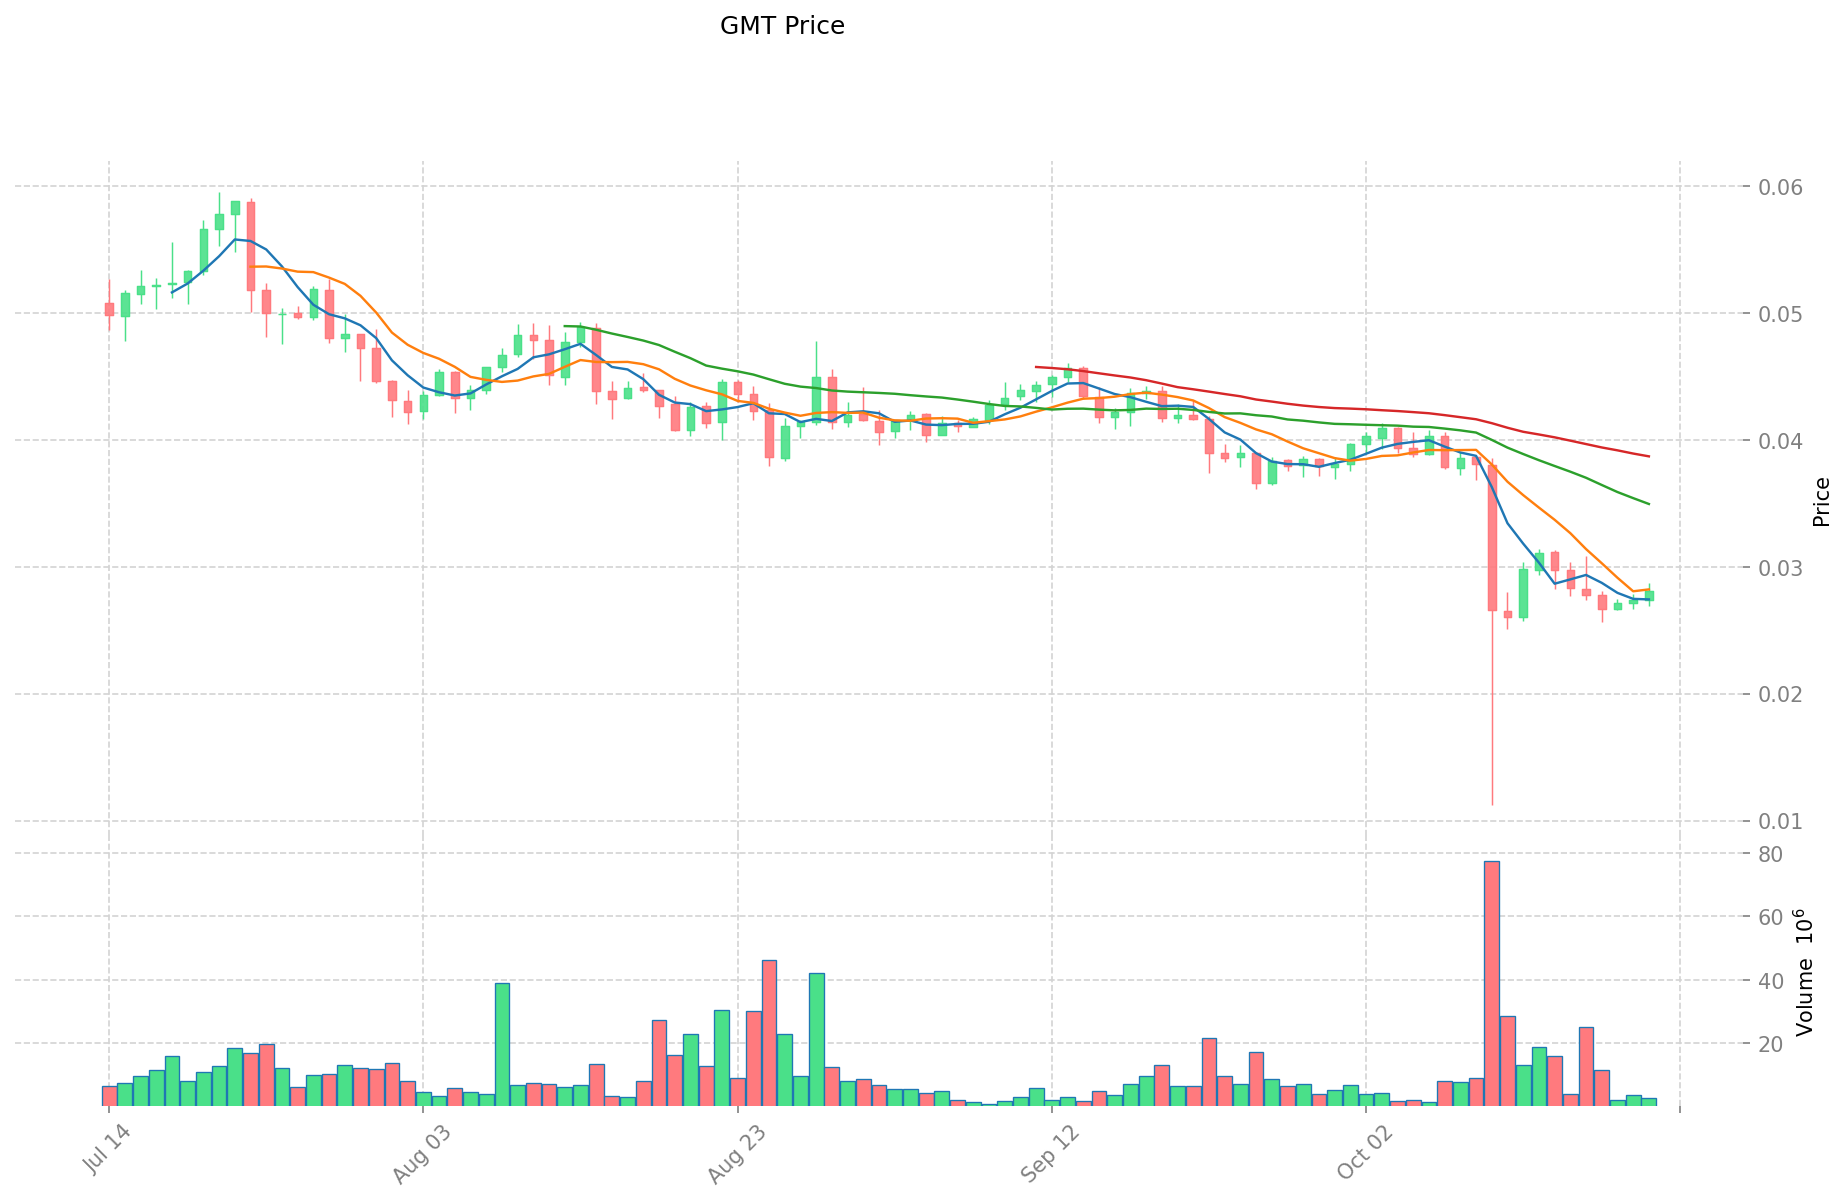
- 2025: Sürekli dalgalanma, fiyat 11 Ekim’de tüm zamanların en düşük seviyesi olan 0,01532444 dolara indi
GMT Güncel Piyasa Durumu
21 Ekim 2025 itibarıyla GMT, 0,02781 dolar seviyesinden işlem görüyor; 24 saatlik işlem hacmi 74.156,15 dolar. Fiyat son 24 saatte %2,72 arttı, ancak son bir haftada %10,16 geriledi. GMT’nin piyasa değeri şu anda 86.528.038,31 dolar ve kripto para piyasasında 446. sırada bulunuyor. Dolaşımdaki arz 3.111.400.155,10 GMT, toplam arz 5.073.850.155,10 GMT ve maksimum arz 6.000.000.000 GMT.
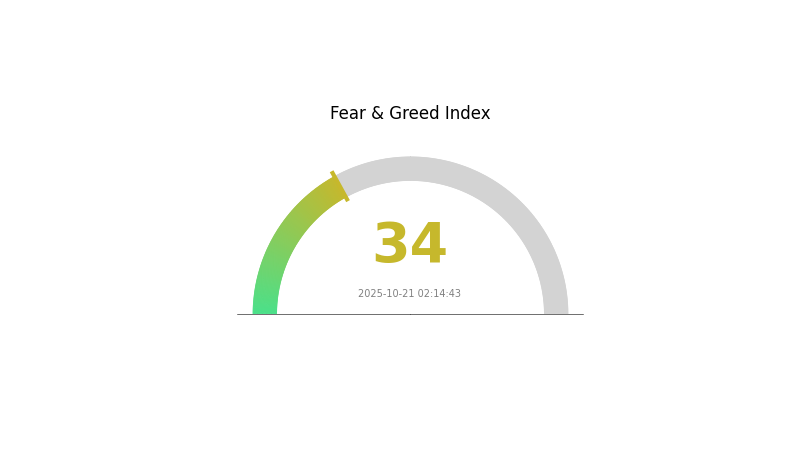
Mevcut fiyat, tüm zamanların en yüksek seviyesinden büyük oranda düşük; bu durum GMT için zorlu bir piyasa ortamına işaret ediyor. Ancak yakın dönemdeki 24 saatlik fiyat artışı, kısa vadeli olumlu bir ivme gösteriyor. Piyasa hissiyatı, Korku ve Açgözlülük Endeksi’nde “Korku” bölgesinde ve değeri 34; bu da yatırımcıların genel olarak temkinli hareket ettiğini gösteriyor.
Güncel GMT piyasa fiyatını görüntüleyin
GMT Piyasa Hissiyatı Göstergesi
21 Ekim 2025 Korku ve Açgözlülük Endeksi: 34 (Korku)
Güncel Korku & Açgözlülük Endeksi için tıklayın
Kripto piyasası şu anda korku halinde; Korku ve Açgözlülük Endeksi 34. Bu, yatırımcıların son dönemdeki belirsizlikler veya olumsuz haberler nedeniyle temkinli davrandığını gösteriyor. Böyle dönemlerde bazı yatırımcılar, “başkaları açgözlü iken kork, başkaları korktuğunda açgözlü ol” yaklaşımı ile bunu alım fırsatı olarak görebilir. Yine de, yatırım kararı öncesi kapsamlı araştırma yapmak ve risk toleransınızı gözden geçirmek şarttır. Piyasa trendlerini takip edin ve Gate.com gibi araçlarla haberdar kalın.
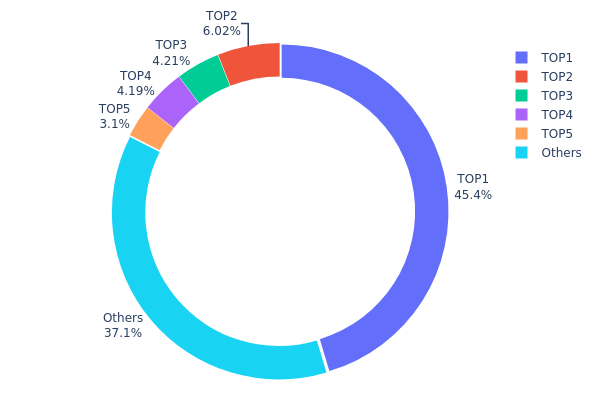
GMT Varlık Dağılımı
Adres bazlı varlık dağılımı verileri, GMT tokenlerinin farklı cüzdanlarda ne kadar yoğunlaştığını gösteriyor. Analizler, GMT tokenlerinin ciddi oranda tekil adreslerde toplandığını ortaya koyuyor; en büyük adres toplam arzın %45,38’ini (90.564,03K token) elinde bulunduruyor. Sonraki dört büyük adres ise arzın %17,49’unu kontrol ediyor; böylece ilk 5 adresin toplam yoğunluğu %62,87’ye ulaşıyor.
Bu yüksek yoğunlaşma, potansiyel piyasa manipülasyonu ve fiyat oynaklığı risklerini artırıyor. Tek bir adresin arzın neredeyse yarısını kontrol etmesi, GMT fiyatında büyük ölçekli satış veya birikimlerin ciddi etkiler yaratmasına neden olabilir. Ayrıca ilk 5 adresin arzın %60’ından fazlasını tutması, merkeziyetsizliğin düşük seviyede olduğunu ve tokenin uzun vadeli istikrarı ile yönetimine olumsuz etki edebileceğini gösteriyor.
Mevcut dağılım modeli, balina hareketlerine karşı kırılgan bir piyasa yapısına işaret ediyor ve dış şoklara karşı direnç seviyesini düşürüyor. Diğer adreslerin elindeki %37,13’lük kısım bir denge oluştursa da, genel zincir üstü yapı merkeziyete yakın; bu da yatırımcılar ve piyasa katılımcıları için dikkat edilmesi gereken bir durum.
Güncel GMT Varlık Dağılımı için tıklayın
| Top | Adres | Varlık Miktarı | Varlık (%) |
|---|---|---|---|
| 1 | 0x5cd7...4e1db2 | 90.564,03K | 45,38% |
| 2 | 0xf89d...5eaa40 | 12.003,77K | 6,01% |
| 3 | 0x53b9...e4cf5c | 8.400,00K | 4,20% |
| 4 | 0x4368...26f042 | 8.369,92K | 4,19% |
| 5 | 0xffff...ffdead | 6.183,73K | 3,09% |
| - | Diğerleri | 74.030,45K | 37,13% |
II. GMT’nin Gelecek Fiyatını Etkileyecek Temel Faktörler
Arz Mekanizması
- Yakım Planı: GMT, arzı azaltmak ve potansiyel değer artışı sağlamak için token yakım mekanizması uyguluyor.
- Güncel Etki: Son dönemde 600 milyon tokenin yakılması piyasada ilgi gördü; olumlu fiyat etkisi beklentisi oluşturdu.
Makroekonomik Çerçeve
- Para Politikası Etkisi: Faiz oranlarındaki değişiklikler ve genel ekonomik politikalar, GMT fiyatını ve genel kripto piyasasını etkileyebilir.
- Enflasyona Karşı Koruma: GMT’nin enflasyonist ortamda gösterdiği performans, varlığın koruma aracı olarak cazibesini belirleyebilir.
Teknolojik Gelişim ve Ekosistem İnşası
- Yapay Zeka Entegrasyonu: StepN, yapay zeka entegrasyonunu hızla benimserse, GMT için yeni değer alanları oluşabilir.
- Sosyal Unsurlar: StepN ekosistemine sosyal özelliklerin eklenmesi, GMT’nin kullanım alanını ve kullanıcı tabanını büyütebilir.
- Ekosistem Uygulamaları: GMT ekosisteminin genişlemesi ve yeni DApp ile projelerin geliştirilmesi, gelecek talep ve fiyatı destekleyebilir.
III. GMT 2025-2030 Fiyat Tahmini
2025 Görünümü
- Temkinli tahmin: 0,02444 - 0,02777 dolar
- Tarafsız tahmin: 0,02777 - 0,03082 dolar
- İyimser tahmin: 0,03082 - 0,03500 dolar (yüksek piyasa benimsemesi gerektirir)
2027-2028 Görünümü
- Piyasa dönemi beklentisi: Potansiyel büyüme dönemi
- Fiyat aralığı tahmini:
- 2027: 0,02073 - 0,04718 dolar
- 2028: 0,02778 - 0,04271 dolar
- Ana katalizörler: Artan kullanım ve yaygın piyasa benimsemesi
2029-2030 Uzun Vadeli Görünüm
- Temel senaryo: 0,04208 - 0,04293 dolar (istikrarlı piyasa büyümesi ile)
- İyimser senaryo: 0,04377 - 0,04636 dolar (olumlu piyasa koşulları ile)
- Dönüştürücü senaryo: 0,05000 - 0,06000 dolar (ekosistemde hızlı büyüme ile)
- 31 Aralık 2030: GMT 0,04636 dolar (muhtemel zirve fiyat)
| Yıl | Tahmini En Yüksek Fiyat | Tahmini Ortalama Fiyat | Tahmini En Düşük Fiyat | Artış/Düşüş (%) |
|---|---|---|---|---|
| 2025 | 0,03082 | 0,02777 | 0,02444 | 0 |
| 2026 | 0,04219 | 0,0293 | 0,02695 | 5 |
| 2027 | 0,04718 | 0,03574 | 0,02073 | 28 |
| 2028 | 0,04271 | 0,04146 | 0,02778 | 49 |
| 2029 | 0,04377 | 0,04208 | 0,02693 | 51 |
| 2030 | 0,04636 | 0,04293 | 0,02318 | 54 |
IV. GMT Profesyonel Yatırım Stratejileri ve Risk Yönetimi
GMT Yatırım Yöntemi
(1) Uzun Vadeli Tutma Stratejisi
- Uygun olanlar: Büyüme odaklı, yüksek risk toleransına sahip yatırımcılar
- İşlem önerileri:
- Piyasa düşüşlerinde GMT biriktirin
- Potansiyel getiriler için en az 1-2 yıl boyunca tutun
- Tokenleri güvenli donanım cüzdanında muhafaza edin
(2) Aktif Alım-Satım Stratejisi
- Teknik analiz araçları:
- Hareketli Ortalamalar: 50 günlük ve 200 günlük MA ile trendleri takip edin
- RSI: Aşırı alım/aşırı satım bölgelerini izleyin
- Dalgalı alım-satım için önemli noktalar:
- Zarar durdur emirleri ile riskinizi sınırlayın
- Önceden belirlenen fiyat hedeflerinde kâr alın
GMT Risk Yönetimi Çerçevesi
(1) Varlık Dağılımı İlkeleri
- Temkinli yatırımcılar: %1-3
- Agresif yatırımcılar: %5-10
- Profesyonel yatırımcılar: %10-20
(2) Riskten Korunma Çözümleri
- Opsiyon stratejileri: Düşüşlere karşı satım opsiyonu ile koruma sağlayın
- Portföy çeşitlendirmesi: GMT’yi diğer kripto varlıklarla birlikte portföye dahil edin
(3) Güvenli Saklama Çözümleri
- Sıcak cüzdan önerisi: Gate Web3 Wallet
- Soğuk saklama: Büyük tutarlar için donanım cüzdan kullanın
- Güvenlik önlemleri: 2FA aktif edin, güçlü şifre kullanın, kurtarma ifadelerini yedekleyin
V. GMT İçin Potansiyel Riskler ve Zorluklar
GMT Piyasa Riskleri
- Yüksek oynaklık: Fiyat dalgalanmaları çok yüksek olabilir
- Rekabet: Diğer kazan-kazan projeleri pazar payı elde edebilir
- Kullanıcı benimsemesi: Sürdürülebilir büyüme yeni kullanıcıların katılımına bağlıdır
GMT Regülasyon Riskleri
- Belirsiz düzenlemeler: Kripto para kuralları küresel ölçekte hâlâ şekilleniyor
- Potansiyel yasaklar: Bazı ülkeler kriptoyla ilgili aktiviteleri kısıtlayabilir
- Vergi etkileri: Değişen vergi mevzuatı GMT sahiplerini etkileyebilir
GMT Teknik Riskleri
- Akıllı sözleşme açıkları: Saldırı veya istismar riski mevcut
- Ölçeklenebilirlik sorunları: Ağ tıkanıklığı kullanıcı deneyimini bozabilir
- Teknolojik eskime: Daha ileri teknolojiler ortaya çıkabilir
VI. Sonuç ve Eylem Önerileri
GMT Yatırım Değeri Değerlendirmesi
GMT, kazan-kazan alanında uzun vadeli potansiyel sunarken, kısa vadede oynaklık ve benimseme zorlukları taşıyor. Projenin başarısı, kullanıcı büyümesi ve ekosistem gelişimine bağlıdır.
GMT Yatırım Tavsiyeleri
✅ Yeni başlayanlar: Küçük pozisyonlarla başlayın, teknolojiyi öğrenmeye odaklanın
✅ Deneyimli yatırımcılar: Maliyet ortalaması yapın, net çıkış stratejileri belirleyin
✅ Kurumsal yatırımcılar: Kapsamlı inceleme yapın, GMT’yi çeşitlendirilmiş kripto portföyüne dahil edin
GMT Alım-Satım Katılım Yöntemleri
- Spot alım-satım: Gate.com üzerinden GMT alıp satabilirsiniz
- Staking: Pasif gelir için GMT staking programlarına katılabilirsiniz
- NFT entegrasyonu: STEPN’in NFT ekosistemini inceleyerek ek fırsatlar değerlendirin
Kripto para yatırımları son derece yüksek risk taşır. Bu makale yatırım tavsiyesi değildir. Yatırımcılar kendi risk toleranslarına göre karar vermeli ve profesyonel finansal danışmanlardan destek almalıdır. Asla kaybetmeyi göze alabileceğinizden fazlasını yatırmayın.
Sıkça Sorulan Sorular
GMT yükselir mi?
GMT’nin fiyatı Bitcoin’e yakın hareket eder. Bitcoin yükselirse GMT’nin de yükselmesi muhtemeldir. Ancak piyasa koşulları öngörülemez; bu nedenle gelecek fiyat hareketleri kesin değildir.
GMT coin neden yükseliyor?
GMT coin’de, muhtemelen belirli bir alım-satım stratejisine bağlı olarak, her gece yarısı görülen ani yükseliş modeli mevcut. Fakat kesin sebebi net değil.
2030’da hangi kripto 1000x yapacak?
Spekülatif olarak, BONK, SHIB ve PEPE gibi meme coin’ler yüksek getiri potansiyeline sahip. Fakat 2030’a kadar 1000x getiri garantisi yoktur.
GMT kriptoya ne oldu?
Binance Labs projeden çekilerek, kalan GMT tokenlarını Binance’e aktardı. Bu durum projenin geleceğinde belirsizlik ve fiyat oynaklığına yol açtı.
Share
Content
Giriş: GMT’nin Piyasa Konumu ve Yatırım Değeri
I. GMT Fiyat Geçmişi ve Güncel Piyasa Durumu
II. GMT’nin Gelecek Fiyatını Etkileyecek Temel Faktörler
III. GMT 2025-2030 Fiyat Tahmini
IV. GMT Profesyonel Yatırım Stratejileri ve Risk Yönetimi
V. GMT İçin Potansiyel Riskler ve Zorluklar
VI. Sonuç ve Eylem Önerileri
Sıkça Sorulan Sorular
How to Buy Cryptocurrency


Trending Cryptocurrencies


GameFi (GAFI) Yatırım İçin Uygun mu?: 2023 Yılında Blockchain Oyun Tokenlarının Potansiyeli ve Risklerinin Analizi

2025 HMSTR Fiyat Tahmini: Hamster Token’ın Büyüme Dinamikleri ve Piyasa Potansiyeli Analizi
2025 CATI Fiyat Tahmini: Merkeziyetsiz Varlık Ekosisteminde Piyasa Trendleri ve Gelecek Büyüme Potansiyelinin Analizi

2025 GAME2 Fiyat Tahmini: Oyun Tokeni'nin Piyasa Trendleri ve Gelecekteki Değerleme Potansiyelinin Analizi

2025 BIGTIME Fiyat Tahmini: Oyun Token’ının gelecekteki değerini belirleyecek büyüme potansiyeli ile piyasa faktörlerinin kapsamlı analizi

2025 MAVIA Fiyat Tahmini: Gelecek Büyüme Analizi ve Yatırımcılar İçin Potansiyel Getiri Oranı
Solana Ağının Kuruluş Zaman Çizelgesi

Solana'nın Token Dağıtımı ve Hakediş Takvimi Hakkında Bilgi Edinmek
Solana'nın Olağanüstü Yolculuğunun Sonu: Tour de Sun 2022'nin Dikkat Çeken Anları