2025 DEFI Price Prediction: Analyzing Market Trends and Future Growth Potential in Decentralized Finance

Introduction: De.Fi's Market Position and Investment Value
De.Fi (DEFI) is a Web3 SocialFi and antivirus platform that combines accessibility and gamification with cutting-edge risk mitigation technology to onboard the next 100 million investors. Since its launch in February 2024, De.Fi has established itself as an innovative solution in the decentralized finance ecosystem. As of December 2025, De.Fi's market capitalization stands at approximately $1,079,510.53, with a circulating supply of 1,878,389,653 tokens, currently trading at $0.0005747. This asset, designed to unlock previously latent opportunities in Web3 investment, continues to play an increasingly important role in democratizing access to decentralized finance.
This article will comprehensively analyze De.Fi's price trends and market dynamics, combining historical patterns, market supply and demand dynamics, and ecosystem development to provide investors with professional price insights and practical investment strategies for informed decision-making in the current market environment.
De.Fi (DEFI) Market Analysis Report
I. DEFI Price History Review and Market Status
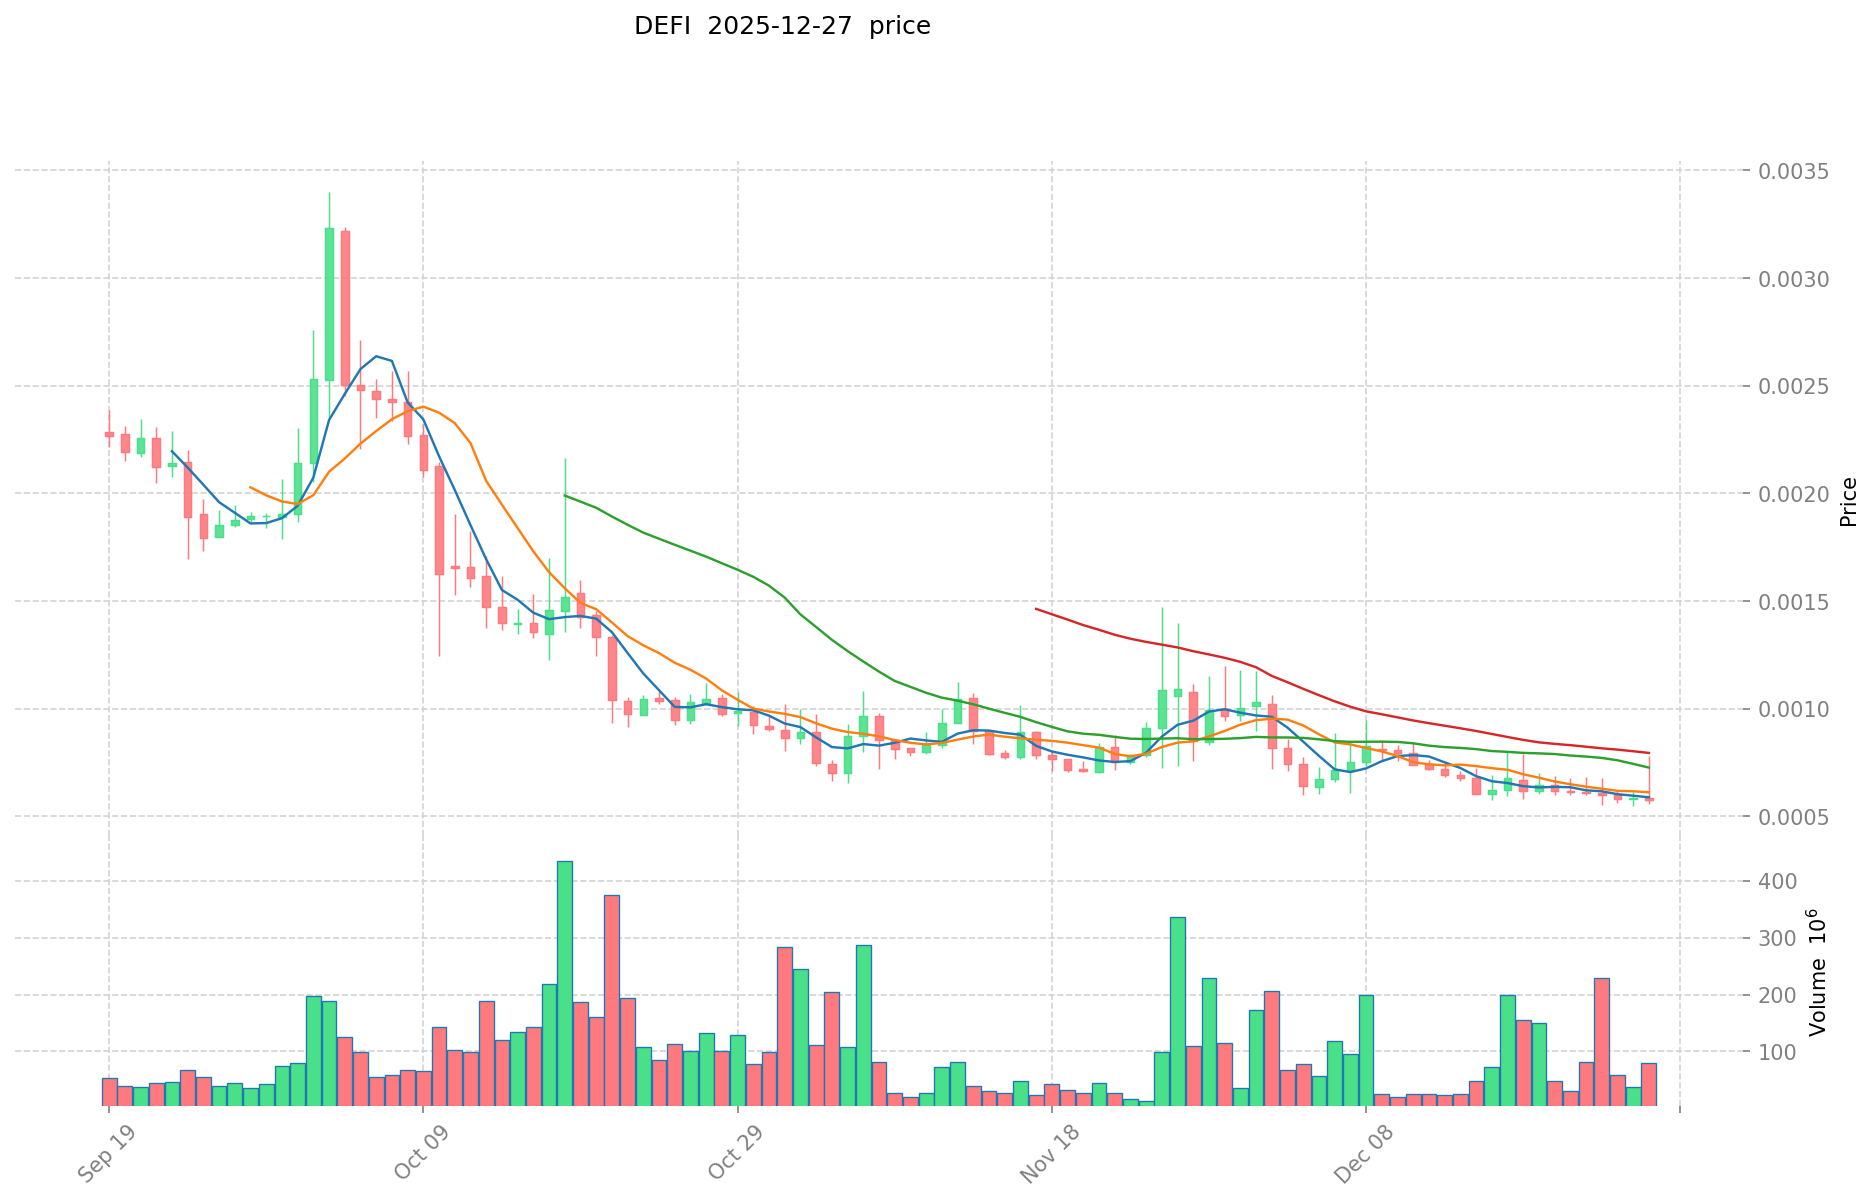
DEFI Historical Price Evolution
- January 31, 2024: All-time high (ATH) reached at $1.09, marking the peak valuation period for the token.
- December 25, 2025: All-time low (ATL) recorded at $0.0005501, reflecting significant downward pressure on token value.
- December 27, 2025: Current trading price at $0.0005747, representing a 97.58% decline from the all-time high over the one-year period.
DEFI Current Market Situation
De.Fi is currently trading at $0.0005747 with a 24-hour trading volume of 48,324.13 DEFI tokens. The token has experienced significant volatility in recent periods, declining 0.66% in the past hour, 1.76% over the last 24 hours, and 11.58% over the past seven days. The 30-day performance shows a steeper decline of 46.98%, while the annual performance reflects an extreme 97.58% depreciation from the previous year's levels.
The market capitalization stands at $1,079,510.53, with a fully diluted valuation (FDV) also at $1,079,510.53, indicating that 62.61% of the maximum token supply is currently in circulation. Out of the maximum supply cap of 3 billion tokens, approximately 1.88 billion DEFI tokens are circulating. The token maintains a presence across 5 exchange platforms and is held by 9,821 unique addresses. De.Fi ranks 2567 globally by market capitalization, with a market dominance of 0.000033%.
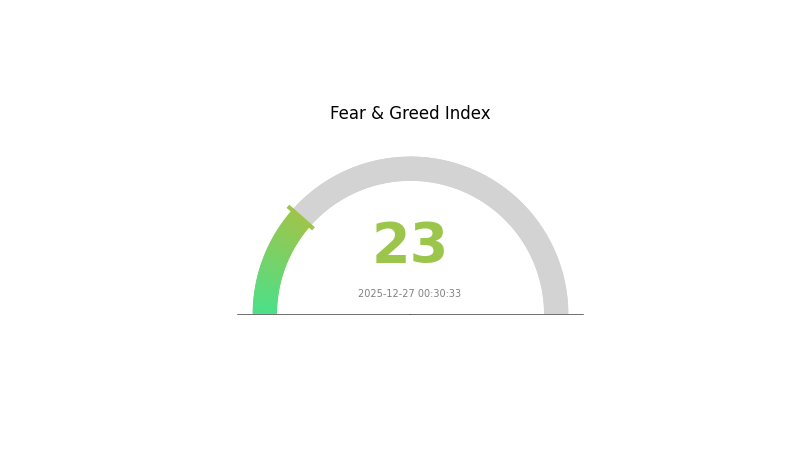
The token's 24-hour trading range spans from a low of $0.0005582 to a high of $0.00078. Current market sentiment indicators reflect an "Extreme Fear" condition with a VIX reading of 23, suggesting heightened market anxiety and risk aversion among investors.
Click to view current DEFI market price
DEFI Market Sentiment Index
2025-12-27 Fear and Greed Index: 23 (Extreme Fear)
Click to view current Fear & Greed Index
The cryptocurrency market is currently experiencing extreme fear, with the Fear and Greed Index plummeting to 23. This historically low reading indicates severe market pessimism and heightened risk aversion among investors. During such periods, market volatility typically increases significantly, presenting both substantial risks and potential opportunities for contrarian traders. Risk management becomes paramount as asset prices may experience sharp downturns. However, long-term investors often view extreme fear as a potential buying opportunity, as oversold conditions frequently precede market recoveries. Monitor key support levels and market developments closely on Gate.com for informed decision-making.
DEFI Holdings Distribution
The address holdings distribution map illustrates the concentration of token ownership across blockchain addresses within a DeFi protocol. This metric reveals how tokens are distributed among individual wallets, with each address's percentage reflecting its proportion of total circulating supply. By analyzing the top holders and the remaining distributed holdings, market participants can assess the degree of decentralization and potential concentration risks inherent in the protocol's token structure.
The current data reveals a moderately concentrated holding pattern, with the top five addresses controlling approximately 43.25% of total token supply. The largest holder commands 11.54% of tokens, while the second and third addresses hold 10.84% and 8.36% respectively. This distribution suggests a multi-stakeholder landscape rather than extreme centralization under a single entity. However, the concentration among the top five holders does warrant monitoring, as coordinated actions by these major stakeholders could theoretically influence protocol governance decisions or market sentiment. The fact that 56.75% of tokens remain distributed among other addresses indicates a reasonably diverse holder base, which provides some degree of decentralization protection.
From a market structure perspective, this distribution pattern presents a balanced risk profile. While the top holders possess sufficient influence to shape governance outcomes, the presence of a substantial distributed holder base (56.75%) serves as a counterweight against unilateral decision-making. This configuration typically enhances protocol resilience and reduces the likelihood of price manipulation through coordinated large-scale transactions. The current holder distribution reflects a maturing DeFi ecosystem where institutional and significant retail participants coexist alongside numerous smaller stakeholders, creating a more stable and organically distributed token economy compared to projects exhibiting extreme concentration ratios.
View current DEFI Holdings Distribution
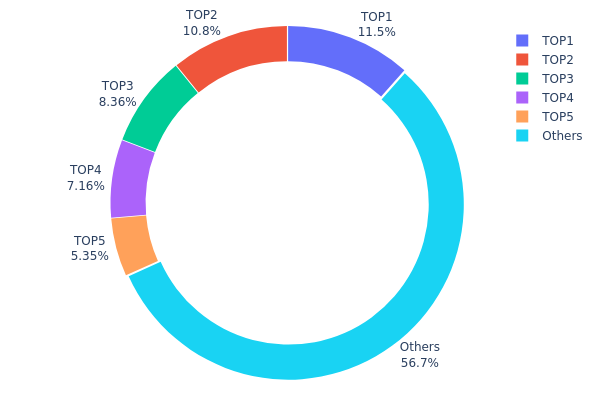
| Top | Address | Holding Qty | Holding (%) |
|---|---|---|---|
| 1 | 0xf89d...5eaa40 | 124879.48K | 11.54% |
| 2 | 0x0d07...b492fe | 117272.31K | 10.84% |
| 3 | 0xbbd3...58015f | 90438.38K | 8.36% |
| 4 | 0x74de...a2f9a1 | 77495.89K | 7.16% |
| 5 | 0x0529...c553b7 | 57876.83K | 5.35% |
| - | Others | 613637.11K | 56.75% |
Core Factors Influencing DeFi Future Price Trends
Institutional and Major Holder Dynamics
-
Institutional Adoption: The launch of spot Bitcoin and Ethereum ETFs has marked institutions' formal entry into the crypto market. With over $50 billion in ETF capital continuously flowing in, institutional money is reshaping the market structure. This represents a fundamental shift from retail-dominated cycles to institutional-driven adoption patterns.
-
Enterprise Participation: Following regulatory green light signals, enterprises are actively seeking exposure to crypto assets. This corporate capital inflow provides a more stable foundation for Ethereum's financial and trading ecosystem, creating sustained long-term demand beyond speculative trading cycles.
-
Real-World Asset Integration: The combination of Traditional Finance (TradFi) and DeFi has become a core 2024-2025 trend. Real asset tokenization, including bonds and real estate, is injecting liquidity into DeFi platforms while opening new investment channels. Projects like MakerDAO are channeling U.S. Treasury yields into DeFi, while Ethena has grown to a $5 billion position by making yield strategies accessible to mainstream users.
-
Regulatory Clarity: Future U.S. government clarity on whether crypto tokens constitute securities could unlock protocol revenue models and dividend distributions. This regulatory evolution is expected to accelerate institutional participation and legitimize DeFi income mechanisms.
Macroeconomic Environment
-
Monetary Policy Impact: DeFi recovery is significantly influenced by Bitcoin ETF adoption, crypto asset legalization, and global interest rate changes. With the Federal Reserve's monetary easing cycle underway and global M2 continuing to expand, cryptocurrency assets—being highly sensitive to liquidity—remain positioned to benefit from prolonged monetary accommodation. The traditional four-year cycle is increasingly viewed as a function of political cycles plus liquidity cycles rather than supply mechanics alone.
-
Inflation Hedge Characteristics: As law currency credit undergoes systemic deterioration, Bitcoin is increasingly viewed as "digital gold" entering sovereign wealth funds, pension funds, and hedge fund balance sheets. Stablecoins are emerging as the "interface layer" for next-generation financial infrastructure, facilitating payment settlement and cross-border capital flows, thereby embedding crypto growth into real economic activity rather than pure speculation.
-
Geopolitical Factors: The broader adoption of crypto assets correlates with institutional recognition of blockchain as a foundation for financial system reconstruction. Market dynamics are increasingly decoupled from traditional four-year cycles, with institutional capital flows and macroeconomic conditions becoming primary price drivers over supply-side variables.
Technology Development and Ecosystem Growth
-
Layer 2 Solutions: Ethereum's high transaction fees and network congestion have created fertile ground for Layer 2 scaling solutions. These platforms demonstrate the critical importance of fast, low-cost transactions combined with decentralization. While competing chains like Solana attract users through low fees, experts recognize Ethereum's superior decentralization and security attributes. Layer 2 deployment in 2024 validated the demand for efficient scaling while maintaining core network security.
-
AI and Blockchain Integration: The convergence of artificial intelligence with blockchain technology opens unprecedented possibilities for DeFi. Projects are developing AI-based autonomous smart contracts and tokenization tools, expanding DeFi's application scenarios and driving related token price increases.
-
Ecosystem Applications: Protocols like Uniswap and Aave have established sustainable revenue models. Protocol income streams are evolving toward dividend-based distributions to token holders. The emergence of successful applications without native tokens—such as prediction markets and trading platforms built on high-performance chains—demonstrates the maturation of blockchain infrastructure. These applications generate substantial revenues independently, signaling a shift away from token-dependent economic models.
-
Real Yield Infrastructure: The shift from subsidy-dependent returns toward genuine yields backed by U.S. Treasury income or leverage market returns represents a fundamental evolution in DeFi economics. This "De-CeFi" hybrid model combines centralized revenue sources with decentralized distribution mechanisms, creating sustainable returns for users.
III. 2025-2030 Price Prediction for DEFI Token
2025 Outlook
- Conservative Forecast: $0.00029 - $0.00057
- Neutral Forecast: $0.00057 (average projection)
- Optimistic Forecast: $0.00074 (strong market sentiment)
2026-2028 Medium-term Outlook
- Market Phase Expectation: Recovery and consolidation phase with gradual price appreciation as market conditions stabilize and institutional interest grows.
- Price Range Predictions:
- 2026: $0.00045 - $0.0009 (+13% upside potential)
- 2027: $0.00046 - $0.00099 (+35% cumulative gains)
- 2028: $0.00046 - $0.00091 (+53% cumulative gains)
- Key Catalysts: DeFi protocol upgrades, increased liquidity on Gate.com and other major platforms, growing mainstream adoption of decentralized finance solutions, and favorable regulatory developments in key markets.
2029-2030 Long-term Outlook
- Base Case Scenario: $0.00059 - $0.0009 (assuming steady market development and moderate institutional participation)
- Optimistic Scenario: $0.00087 - $0.00118 (assuming accelerated DeFi adoption and positive macroeconomic conditions leading to +55-80% gains)
- Transformative Scenario: Above $0.00118 (contingent upon breakthrough technological innovations, major enterprise partnerships, or significant expansion of DeFi use cases in global finance)
- December 27, 2030: DEFI token projected at $0.00108 (stable growth trajectory with sustained market confidence)
| 年份 | 预测最高价 | 预测平均价格 | 预测最低价 | 涨跌幅 |
|---|---|---|---|---|
| 2025 | 0.00074 | 0.00057 | 0.00029 | 0 |
| 2026 | 0.0009 | 0.00065 | 0.00045 | 13 |
| 2027 | 0.00099 | 0.00078 | 0.00046 | 35 |
| 2028 | 0.00091 | 0.00088 | 0.00046 | 53 |
| 2029 | 0.00118 | 0.0009 | 0.00059 | 55 |
| 2030 | 0.00108 | 0.00104 | 0.00087 | 80 |
De.Fi (DEFI) Professional Investment Strategy & Risk Management Report
I. Executive Summary
De.Fi is a Web3 SocialFi and antivirus platform that combines accessibility and gamification with advanced risk mitigation technology. As of December 27, 2025, DEFI is trading at $0.0005747, with a market capitalization of approximately $1,079,510.53 USD. The token has experienced significant downward pressure over the past year, declining 97.58% from its all-time high of $1.09 reached on January 31, 2024.
Key Metrics:
- Current Price: $0.0005747
- 24H Change: -1.76%
- Market Cap: $1,079,510.53 USD
- Circulating Supply: 1,878,389,653 DEFI
- Total Supply: 1,878,389,653 DEFI
- Maximum Supply: 3,000,000,000 DEFI
- Market Rank: #2567
II. De.Fi Project Overview
Project Fundamentals
De.Fi positions itself as a Web3 SocialFi and antivirus solution designed to onboard the next 100 million investors. The project combines social finance elements with risk mitigation technology to make Web3 investment more accessible and secure.
Token Economics
- Current Circulating Supply Ratio: 62.61% of maximum supply
- Remaining Inflation Potential: 37.39% (1,121,610,347 DEFI tokens)
- Contract Address: 0x6b0faca7ba905a86f221ceb5ca404f605e5b3131 (Ethereum Network)
- Token Standard: ERC-20
- Current Holders: 9,821
Market Performance
De.Fi has experienced extreme volatility since its launch at $0.2 in February 2024:
| Timeframe | Price Change | Change Amount |
|---|---|---|
| 1 Hour | -0.66% | -$0.000003818 |
| 24 Hours | -1.76% | -$0.000010296 |
| 7 Days | -11.58% | -$0.000075266 |
| 30 Days | -46.98% | -$0.000509231 |
| 1 Year | -97.58% | -$0.023173234 |
III. De.Fi Professional Investment Strategy & Risk Management
De.Fi Investment Methodology
(1) Long-Term Position Strategy
Suitable For: Patient investors with high risk tolerance and long-term investment horizons of 3+ years
Operational Recommendations:
- Entry Strategy: Consider dollar-cost averaging (DCA) during periods of extreme weakness to reduce timing risk
- Position Sizing: Limit DEFI allocation to no more than 1-3% of total cryptocurrency portfolio due to extreme volatility
- Monitoring Approach: Track project development milestones, user adoption metrics, and competitive positioning in the SocialFi space
(2) Active Trading Strategy
Technical Analysis Considerations:
- Volatility Assessment: DEFI exhibits extreme price swings; use wider stop-loss levels (15-20% minimum)
- Liquidity Analysis: Daily volume of $48,324.13 is relatively low; exercise caution with large position sizes
- Support/Resistance Tracking: Monitor historical price levels at $0.0005501 (ATL) and $0.00078 (24H high)
Swing Trading Entry Points:
- Buy Confirmation: Look for volume confirmation above 30-day moving average; enter on reversal patterns
- Take-Profit Targets: Set realistic targets of 10-15% returns given market conditions
- Exit Rules: Implement strict stop-losses at 10% below entry to protect against rapid liquidation
De.Fi Risk Management Framework
(1) Asset Allocation Principles
Given De.Fi's extreme volatility and current market conditions:
- Conservative Investors: 0-0.5% portfolio allocation
- Aggressive Investors: 1-3% portfolio allocation
- Professional Traders: 2-5% trading capital allocation (only for experienced traders)
(2) Risk Hedging Strategies
- Position Sizing Hedge: Never allocate capital you cannot afford to lose completely; DEFI carries significant risk of total loss
- Time Diversification: Spread investments across multiple months rather than lump-sum purchases to reduce entry risk
(3) Secure Storage Solutions
Hot Wallet Approach:
- For active trading: Use Gate.com's secure trading interface with two-factor authentication (2FA) and withdrawal whitelist features
- For temporary holdings: Enable all security features including email verification and IP whitelisting
Cold Storage Consideration:
- For long-term holdings beyond 6 months, consider transferring to a personal wallet address you control
- Maintain detailed records of private keys in a secure, offline location
Critical Security Measures:
- Enable two-factor authentication on all exchange accounts
- Use strong, unique passwords (minimum 16 characters with mixed case, numbers, and symbols)
- Never share recovery phrases or private keys
- Verify wallet addresses before every transaction
- Use hardware-secured backup methods for sensitive information
IV. De.Fi Potential Risks & Challenges
Market Risks
- Extreme Volatility: DEFI has declined 97.58% from ATH; additional downside risk remains substantial, with potential for further losses below current prices
- Low Liquidity: Daily trading volume of $48,324.13 is insufficient to absorb large positions without significant price impact
- Market Sentiment: Current market emotion rating of 2/10 indicates extreme bearish sentiment, creating potential for continued selling pressure
Regulatory Risks
- SocialFi Regulatory Uncertainty: Web3 social finance platforms face increasing regulatory scrutiny; potential SEC or global regulatory actions could impact project viability
- Securities Classification Risk: If DEFI token is reclassified as a security, trading restrictions and compliance requirements could significantly impact liquidity and value
Technology Risks
- Smart Contract Risk: ERC-20 token contracts on Ethereum may contain undiscovered vulnerabilities; potential for exploitation could result in token loss
- Adoption Risk: The SocialFi space remains highly competitive with limited proven use cases; De.Fi's technology may not achieve projected user adoption targets
- Competitive Pressure: Established platforms with larger communities and resources pose significant competitive threats to market share and value proposition
V. Conclusion & Action Recommendations
De.Fi Investment Value Assessment
De.Fi represents an extremely high-risk speculative investment. The project's 97.58% decline from all-time highs reflects both market cycle dynamics and potential concerns about product-market fit in the competitive SocialFi landscape. While the project's focus on accessibility and risk mitigation presents interesting use cases, the significant drawdown and low liquidity present substantial challenges for investors. The current valuation may reflect depressed sentiment, but this does not guarantee recovery.
De.Fi Investment Recommendations
✅ Beginners: Only consider De.Fi as a micro-allocation (0.1-0.5% of cryptocurrency portfolio) for high-risk experimentation; do not allocate funds required for essential expenses or short-term needs
✅ Experienced Investors: Implement disciplined position sizing (1-3% maximum); use technical analysis to identify potential reversal patterns; maintain strict risk management with pre-set stop-losses at 10% below entry
✅ Institutional Investors: Conduct thorough due diligence on development roadmap, team credibility, and competitive positioning before any allocation; consider De.Fi only as small allocation within diversified alternative assets strategy; engage legal counsel regarding regulatory implications
De.Fi Trading Participation Methods
- Direct Purchase: Trade DEFI on Gate.com with real-time market data, advanced charting tools, and secure trading infrastructure
- Dollar-Cost Averaging: Establish automated regular purchases over 6-12 month periods to reduce timing risk and average entry cost
- Limit Order Strategy: Use Gate.com's limit order functionality to establish disciplined entry and exit points without emotional trading decisions
Cryptocurrency investment carries extreme risk and potential for total loss. This report does not constitute investment advice. Investors must carefully evaluate their personal risk tolerance, investment objectives, and financial situation before making any trading decisions. Consult with qualified financial advisors before deploying capital. Never invest more than you can afford to lose completely. De.Fi's extreme volatility and significant historical declines mean investors should approach with extreme caution.
FAQ
Is DeFi a good stock to buy?
DeFi Technologies (DEFT) holds a Strong Buy rating from analysts with a 12-month price target of $5.17. Market conditions and professional advice should guide your investment decision.
Can a DeFi coin reach 1 dollar?
Yes, theoretically a DeFi coin can reach $1 if it achieves significant adoption, increased utility, and market demand. However, it would require substantial growth from current levels and favorable market conditions to achieve this price target.
Is DeFi coin a good investment?
DeFi coins show strong growth potential with increasing adoption and trading volume. Market analysis suggests bullish trends ahead, making them attractive for forward-looking investors seeking exposure to decentralized finance innovation.
What is the future of DeFi in 2025?
DeFi in 2025 will be driven by real-world asset tokenization, enabling tangible assets like real estate and commodities on blockchain. Cross-chain interoperability will expand seamlessly, while enhanced insurance protocols and AI-powered platforms strengthen security and institutional adoption.
What factors influence DeFi token prices?
DeFi token prices are influenced by fee revenue, token utility, supply mechanics, and market demand. Governance rights, liquidity depth, protocol performance, and user adoption also significantly impact price movements.
What are the risks of investing in DeFi coins?
DeFi investing involves smart contract vulnerabilities, malicious attacks, market volatility, regulatory uncertainties, and liquidity risks. Impermanent loss affects liquidity providers. Conduct thorough research and use secure wallets to mitigate these risks.
How do I analyze DeFi price trends and make predictions?
Analyze DeFi price trends by monitoring key technical indicators, trading volume, liquidity levels, and market sentiment. Use historical data patterns and on-chain metrics to identify potential price movements. Apply algorithmic models and trend analysis to make informed predictions based on current market conditions.
Share
Content
Introduction: De.Fi's Market Position and Investment Value
I. DEFI Price History Review and Market Status
Core Factors Influencing DeFi Future Price Trends
III. 2025-2030 Price Prediction for DEFI Token
I. Executive Summary
II. De.Fi Project Overview
III. De.Fi Professional Investment Strategy & Risk Management
IV. De.Fi Potential Risks & Challenges
V. Conclusion & Action Recommendations
FAQ
How to Buy Cryptocurrency


Trending Cryptocurrencies


What is FLR: Understanding the Flare Network's Token and Its Role in Blockchain Innovation

What is INJ: Understanding the Innovative Blockchain Protocol Transforming DeFi

2025 ZETA Price Prediction: Will the Emerging Layer-1 Blockchain Reach New Heights in the Post-Bull Market Era?

How Active is the Kaspa Community and Ecosystem in 2025?

What is LSK: Understanding the Blockchain Platform Powering Decentralized Applications
What is INIT: Understanding the System Initialization Process in Modern Computing

How to Stake Chainlink: A Step-by-Step Guide to LINK Staking

AlphaArena Model Launch: How AI is Redefining Crypto Trading with Real-World Benchmarks

How to Participate in Chainlink Airdrop

SpaceX Transfers $105 Million in Bitcoin to Unmarked Wallets

Why Do We Celebrate Bitcoin Pizza Day?