2025 CGN Price Prediction: Analyzing Market Trends and Growth Potential for Caganu Coin
Introduction: CGN's Market Position and Investment Value
Cygnus (CGN), as the industry's first Instagram App Layer, has been merging on-chain and off-chain assets to power the creator economy since its inception. As of 2025, Cygnus has a market capitalization of $4,567,800, with a circulating supply of approximately 2,300,000,000 tokens, and a price hovering around $0.001986. This asset, known as the "Web3 Creator Economy Enabler," is playing an increasingly crucial role in bridging the gap between traditional social media and blockchain technology.
This article will comprehensively analyze Cygnus's price trends from 2025 to 2030, combining historical patterns, market supply and demand, ecosystem development, and macroeconomic factors to provide investors with professional price predictions and practical investment strategies.
I. CGN Price History Review and Current Market Status
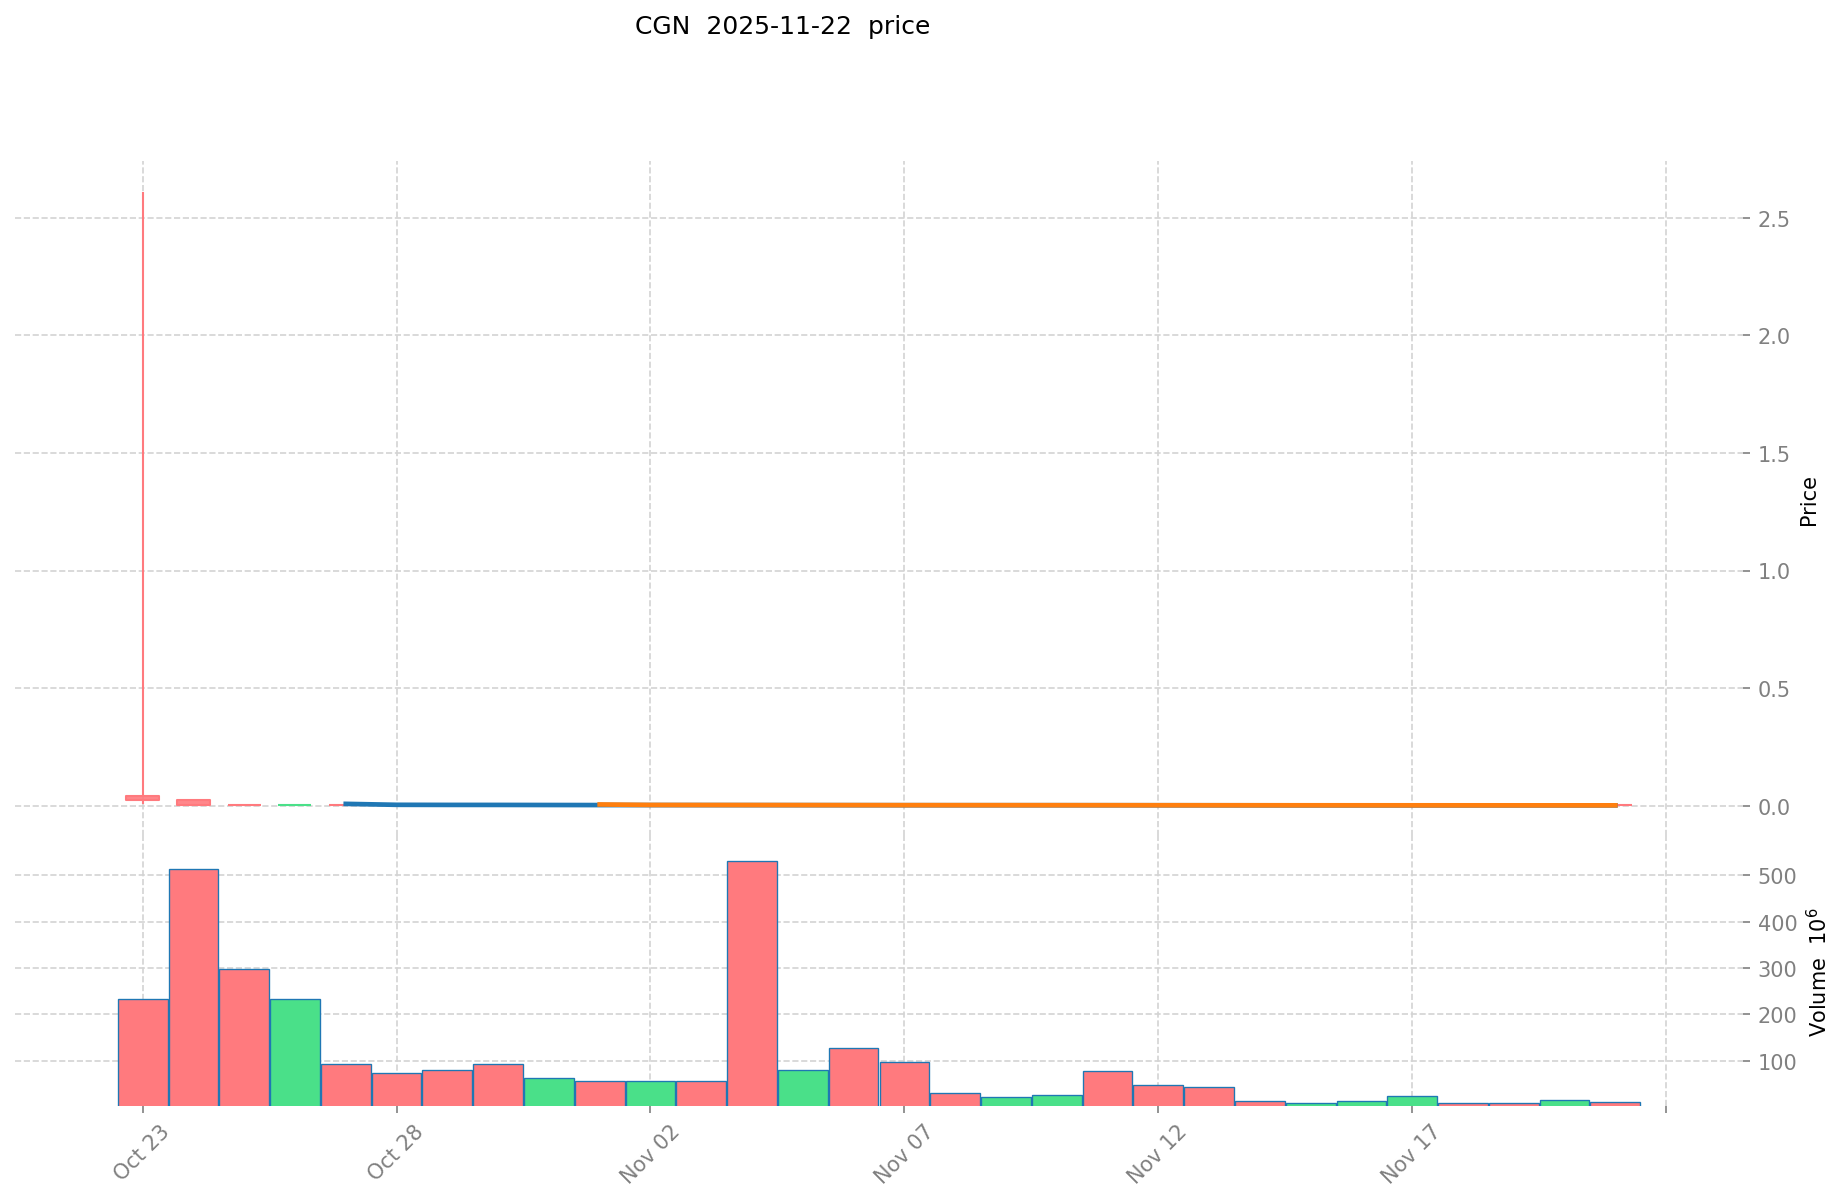
CGN Historical Price Evolution
- 2025 (October): CGN reached its all-time high of $2.6106, marking a significant milestone for the project
- 2025 (November): The price experienced a sharp decline, dropping to its all-time low of $0.001549
- 2025 (Current): CGN is in a recovery phase, with the price stabilizing around $0.001986
CGN Current Market Situation
CGN is currently trading at $0.001986, showing a slight decrease of 0.05% in the last 24 hours. The token has a market capitalization of $4,567,800, ranking it at 1618 in the overall cryptocurrency market. Despite the recent price stabilization, CGN has experienced significant volatility over the past year, with a 99.90% decrease from its all-time high. The trading volume in the last 24 hours stands at $18,503.08, indicating moderate market activity. With a circulating supply of 2,300,000,000 CGN out of a total supply of 10,000,000,000, the token has a circulating ratio of 23%. The fully diluted valuation of CGN is $19,860,000, suggesting potential for growth if the project gains more traction in the market.
Click to view the current CGN market price
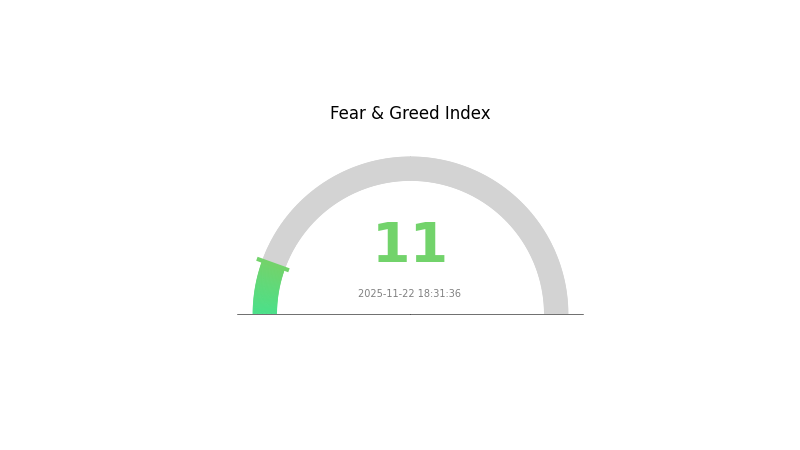
CGN Market Sentiment Indicator
2025-11-22 Fear and Greed Index: 11 (Extreme Fear)
Click to view the current Fear & Greed Index
The crypto market is currently gripped by extreme fear, with the sentiment index plummeting to 11. This level of pessimism often signals a potential buying opportunity for contrarian investors. However, it's crucial to exercise caution and conduct thorough research before making any investment decisions. The extreme fear could be indicative of underlying market concerns or external factors affecting investor confidence. As always, diversification and risk management remain key strategies in navigating volatile crypto markets.
CGN Holdings Distribution
The address holdings distribution reveals a high concentration of CGN tokens among a few top addresses. The top 5 addresses collectively hold 82.84% of the total supply, with the largest holder possessing 22% of all tokens. This concentration pattern indicates a potentially centralized ownership structure, which may raise concerns about market manipulation and price volatility.
Such a concentrated distribution could lead to significant market impacts if large holders decide to sell or transfer their holdings. The top two addresses alone control 42% of the supply, potentially giving them substantial influence over the token's market dynamics. This level of concentration may also affect the perceived decentralization of the CGN ecosystem.
While some concentration is common in many cryptocurrency projects, especially in their early stages, the current CGN distribution suggests a need for increased token circulation and wider adoption to improve market stability and reduce manipulation risks. Investors should monitor any changes in these large holdings, as they could signal important shifts in the token's market structure and future price movements.
Click to view the current CGN Holdings Distribution
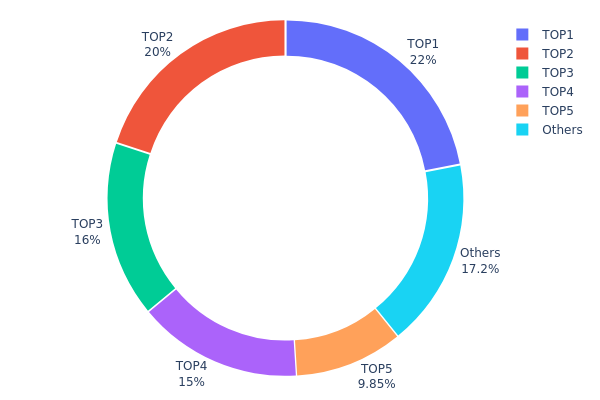
| Top | Address | Holding Qty | Holding (%) |
|---|---|---|---|
| 1 | 0x2de5...fc9680 | 2200000.00K | 22.00% |
| 2 | 0x31ad...3e2de5 | 2000000.00K | 20.00% |
| 3 | 0x9997...ba6e72 | 1600000.00K | 16.00% |
| 4 | 0xd4e9...247b55 | 1500000.00K | 14.99% |
| 5 | 0x48bb...66be0d | 985000.00K | 9.85% |
| - | Others | 1715000.00K | 17.16% |
II. Key Factors Influencing CGN's Future Price
Supply Mechanism
- Fixed Supply: CGN has a fixed total supply, which can create scarcity and potentially drive up the price as demand increases.
- Historical Pattern: Limited supply has historically led to price appreciation in cryptocurrencies with fixed supplies.
- Current Impact: The fixed supply mechanism is expected to continue supporting CGN's price, especially if demand grows.
Macroeconomic Environment
- Inflation Hedging Properties: As a cryptocurrency, CGN may be viewed as a potential hedge against inflation, similar to other digital assets.
- Geopolitical Factors: Global economic uncertainties and geopolitical tensions could drive interest in alternative assets like CGN.
Technical Development and Ecosystem Building
- Ecosystem Applications: The development of DApps and other projects within the CGN ecosystem could enhance its utility and potentially drive demand.
III. CGN Price Prediction for 2025-2030
2025 Outlook
- Conservative prediction: $0.00115 - $0.00150
- Neutral prediction: $0.00150 - $0.00198
- Optimistic prediction: $0.00198 - $0.00232 (requires positive market sentiment and increased adoption)
2027-2028 Outlook
- Market phase expectation: Potential growth phase with increasing momentum
- Price range forecast:
- 2027: $0.00139 - $0.00337
- 2028: $0.00257 - $0.00408
- Key catalysts: Technological advancements, wider market acceptance, and potential partnerships
2029-2030 Long-term Outlook
- Base scenario: $0.00352 - $0.00418 (assuming steady market growth and continued project development)
- Optimistic scenario: $0.00418 - $0.00485 (assuming strong market performance and significant adoption)
- Transformative scenario: $0.00485 - $0.00550 (assuming breakthrough innovations and mainstream integration)
- 2030-12-31: CGN $0.00435 (potential peak before year-end consolidation)
| 年份 | 预测最高价 | 预测平均价格 | 预测最低价 | 涨跌幅 |
|---|---|---|---|---|
| 2025 | 0.00232 | 0.00198 | 0.00115 | 0 |
| 2026 | 0.00292 | 0.00215 | 0.00114 | 8 |
| 2027 | 0.00337 | 0.00254 | 0.00139 | 27 |
| 2028 | 0.00408 | 0.00295 | 0.00257 | 48 |
| 2029 | 0.00485 | 0.00352 | 0.00334 | 77 |
| 2030 | 0.00435 | 0.00418 | 0.00364 | 110 |
IV. CGN Professional Investment Strategies and Risk Management
CGN Investment Methodology
(1) Long-term Holding Strategy
- Suitable for: Long-term investors with high risk tolerance
- Operation suggestions:
- Accumulate CGN during market dips
- Set price targets for partial profit-taking
- Store in secure non-custodial wallets
(2) Active Trading Strategy
- Technical analysis tools:
- Moving Averages: Monitor short-term and long-term trends
- RSI: Identify overbought and oversold conditions
- Key points for swing trading:
- Set stop-loss orders to manage downside risk
- Take profits at predetermined resistance levels
CGN Risk Management Framework
(1) Asset Allocation Principles
- Conservative investors: 1-3%
- Aggressive investors: 5-10%
- Professional investors: 10-15%
(2) Risk Hedging Solutions
- Diversification: Spread investments across multiple crypto assets
- Stop-loss orders: Implement to limit potential losses
(3) Secure Storage Solutions
- Hot wallet recommendation: Gate Web3 Wallet
- Cold storage solution: Hardware wallet for long-term holdings
- Security precautions: Use 2FA, avoid public Wi-Fi for transactions
V. CGN Potential Risks and Challenges
CGN Market Risks
- High volatility: Extreme price fluctuations common in crypto markets
- Liquidity risk: Potential difficulty in executing large trades
- Competition: Other social media-focused crypto projects may emerge
CGN Regulatory Risks
- Uncertain regulatory landscape: Potential for stricter regulations on crypto assets
- Compliance challenges: Changing requirements for social media integration with blockchain
- Cross-border restrictions: Varying regulations across different jurisdictions
CGN Technical Risks
- Smart contract vulnerabilities: Potential for exploits or bugs in the underlying code
- Scalability issues: Possible network congestion as user base grows
- Integration challenges: Potential difficulties in seamlessly merging blockchain with Instagram
VI. Conclusion and Action Recommendations
CGN Investment Value Assessment
CGN presents a unique value proposition as the first Instagram App Layer in the crypto space. While it offers potential long-term growth tied to the creator economy and Web3 adoption, short-term volatility and regulatory uncertainties pose significant risks.
CGN Investment Recommendations
✅ Newcomers: Start with small, affordable investments to gain exposure ✅ Experienced investors: Consider a moderate allocation as part of a diversified crypto portfolio ✅ Institutional investors: Conduct thorough due diligence and consider CGN as part of a broader Web3 investment strategy
CGN Trading Participation Methods
- Spot trading: Buy and sell CGN on Gate.com
- Staking: Participate in staking programs if available to earn passive income
- DeFi integration: Explore decentralized finance opportunities involving CGN tokens
Cryptocurrency investments carry extremely high risks, and this article does not constitute investment advice. Investors should make decisions carefully based on their own risk tolerance and are advised to consult professional financial advisors. Never invest more than you can afford to lose.
FAQ
Can compound reach $1000?
While ambitious, reaching $1000 is unlikely for Compound in the near future. Its all-time high was around $910 in 2021. Significant market growth and adoption would be needed for such a price target.
Can KDA reach $100?
While ambitious, KDA reaching $100 is possible in the long term with increased adoption, network growth, and favorable market conditions. However, it would require significant market cap expansion and should be viewed as a speculative target.
Which coin will reach $1 in 2030?
While it's difficult to predict with certainty, some analysts believe Cardano (ADA) has the potential to reach $1 by 2030, given its strong technology and growing adoption.
Can Coti reach $10?
While ambitious, reaching $10 is possible for Coti in the long term with significant adoption and market growth. However, it would require substantial increases in market cap and demand.
Share
Content
Introduction: CGN's Market Position and Investment Value
I. CGN Price History Review and Current Market Status
II. Key Factors Influencing CGN's Future Price
III. CGN Price Prediction for 2025-2030
IV. CGN Professional Investment Strategies and Risk Management
V. CGN Potential Risks and Challenges
VI. Conclusion and Action Recommendations
FAQ

