2025 AT Price Prediction: Expert Analysis and Market Forecast for the Year Ahead


Introduction: AT's Market Position and Investment Value
APRO Token (AT) serves as an AI-enhanced oracle infrastructure powering next-generation ecosystems across real-world assets (RWA), artificial intelligence, prediction markets, and decentralized finance (DeFi). With a current market capitalization of $21.00 million and a circulating supply of 230 million tokens, AT is priced at approximately $0.0913. This innovative oracle solution, which delivers verified real-time data across 1,400+ data feeds on 40+ blockchains, is establishing a new benchmark for decentralized data infrastructure in the crypto ecosystem.
This article will provide a comprehensive analysis of AT's price trajectory through 2030, incorporating historical price patterns, market supply and demand dynamics, ecosystem development, and macroeconomic factors to deliver professional price forecasts and practical investment strategies for investors.
I. AT Price History Review and Current Market Status
AT Historical Price Evolution Trajectory
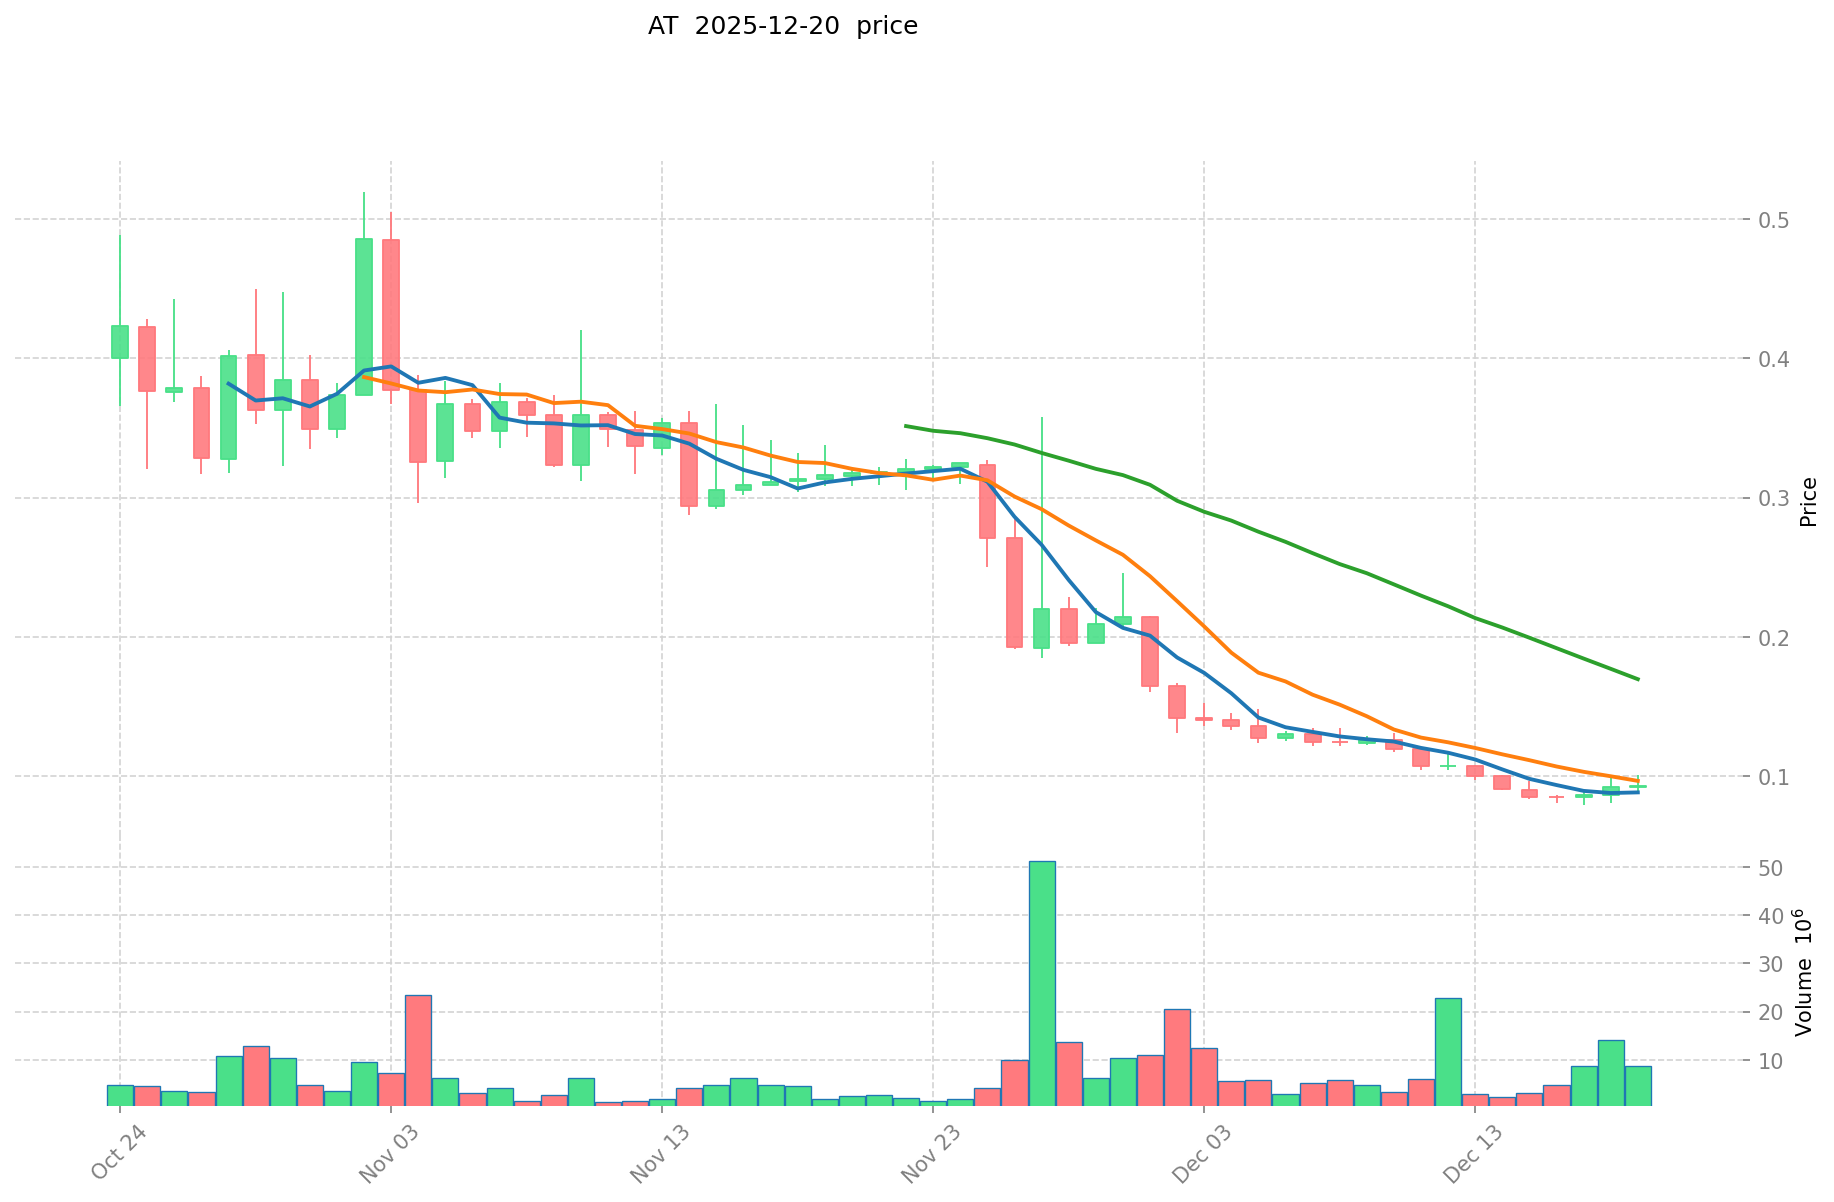
Based on available market data, APRO Token (AT) has experienced significant volatility since its launch. The token reached its all-time high of $0.5196 on November 2, 2025, representing a peak valuation period for the project. Subsequently, the token entered a correction phase, declining substantially over the following weeks. The all-time low of $0.07888 was recorded on December 17, 2025, marking a dramatic 84.8% decline from the peak within approximately six weeks.
AT Current Market Status
As of December 20, 2025, APRO Token is trading at $0.09131, representing a modest recovery of approximately 15.8% from its recent low. Over the past 24 hours, AT has declined by 3.58%, with the intraday range between $0.08906 and $0.09582. The 7-day performance shows a decline of 7.96%, while the 30-day period reflects a more severe correction of 70.92% from earlier December levels.
The token maintains a market capitalization of $21.00 million with a fully diluted valuation of $91.31 million, reflecting a market dominance of 0.0028%. Current circulating supply stands at 230 million AT tokens out of a total supply of 1 billion tokens, representing 23% circulation. Trading volume over the past 24 hours totaled $516,689, indicating moderate liquidity across 21 trading pairs. The token has attracted 44,658 token holders, demonstrating a distributed ownership base.
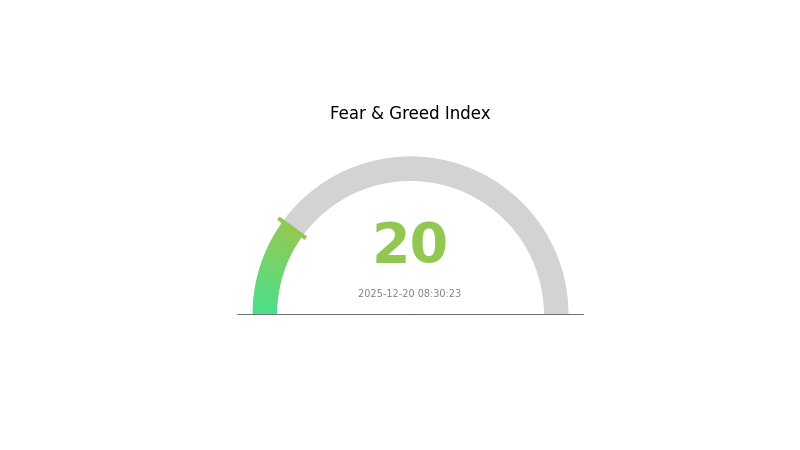
The broader market sentiment remains in "Extreme Fear" territory with a VIX reading of 20, which typically correlates with heightened market volatility and risk aversion among investors.
Click to view current AT market price
AT Market Sentiment Indicator
2025-12-20 Fear and Greed Index: 20 (Extreme Fear)
Click to view current Fear & Greed Index
The cryptocurrency market is experiencing extreme fear with an index reading of 20. This indicates investors are highly risk-averse and pessimistic about near-term market conditions. Such extreme fear levels often signal capitulation and potential accumulation opportunities for contrarian traders. Market participants should exercise caution while monitoring for signs of reversal. Extreme fear periods historically tend to precede significant recoveries, making this an important inflection point to watch closely on Gate.com.
AT Holdings Distribution
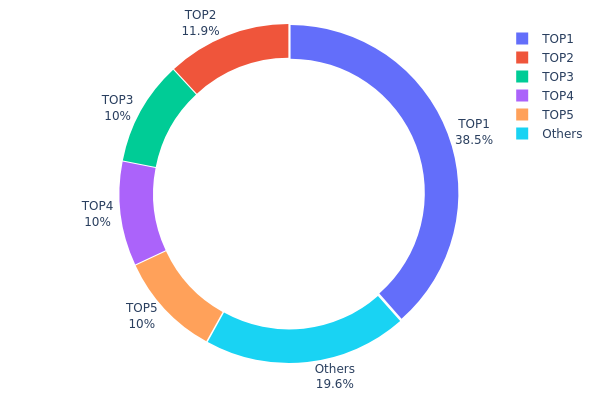
The address holdings distribution chart illustrates the concentration of token ownership across the blockchain network, revealing the extent to which AT tokens are distributed among major stakeholders. This metric serves as a critical indicator of market structure, liquidity dynamics, and potential governance concentration risks within the ecosystem.
The current holdings distribution of AT exhibits pronounced concentration characteristics. The top holder commands 38.50% of total supply, while the second-largest holder accounts for 11.93%, collectively representing over half of all circulating tokens. The subsequent three addresses each maintain 10.00% holdings, bringing the cumulative share of the top five holders to approximately 80.43% of the total supply. This distribution pattern indicates significant token concentration among a limited number of addresses, raising concerns about potential market manipulation and decision-making centralization.
The concentration level observed presents notable implications for market dynamics and ecosystem stability. With approximately 80% of tokens concentrated in the top five addresses, the market exhibits reduced resilience to price volatility originating from coordinated movements by major holders. The remaining 19.57% distributed among other addresses suggests a relatively fragmented secondary holder base, which could limit natural price discovery mechanisms. While such concentration patterns are not uncommon in emerging token ecosystems or those with substantial institutional allocations, they underscore the importance of monitoring large holder movements and governance participation to ensure sustainable decentralization and community engagement over time.
Click to view current AT Holdings Distribution
| Top | Address | Holding Qty | Holding (%) |
|---|---|---|---|
| 1 | 0xb6f6...1da6e7 | 385000.12K | 38.50% |
| 2 | 0x8894...e2d4e3 | 119331.71K | 11.93% |
| 3 | 0x3763...ef9bae | 100000.00K | 10.00% |
| 4 | 0x4bf1...ae8669 | 100000.00K | 10.00% |
| 5 | 0x2ea8...cfc3cb | 100000.00K | 10.00% |
| - | Others | 195668.17K | 19.57% |
II. Core Factors Influencing AT's Future Price
Adoption Rates and Market Cap Growth
-
Adoption Dynamics: AT's future price is significantly influenced by adoption rates and market capitalization expansion. As more users and institutions integrate AT into their operations, market cap growth becomes a key driver of price appreciation.
-
Market Cap Expansion Potential: Analysis indicates that AT has substantial potential for market cap growth, with adoption serving as a primary catalyst for price appreciation over the medium to long term.
Macroeconomic Environment
-
Monetary Policy Impact: AT's price performance is influenced by broader macroeconomic trends and central bank policy decisions. Changes in global monetary conditions can affect capital flows into cryptocurrency assets and impact investor sentiment toward risk assets like AT.
-
Capital Flow Dynamics: The cryptocurrency market, including AT, is sensitive to shifts in global capital allocation. When investors seek higher-risk, higher-return opportunities, capital tends to flow into tech-related assets, which can support AT price appreciation. Conversely, risk-off market conditions may redirect capital away from cryptocurrencies.
Technological Development and Regulatory Environment
-
Regulatory Changes: Regulatory developments represent a critical factor in AT's price trajectory. Changes in cryptocurrency regulation and policy frameworks can create both opportunities and headwinds for price movement.
-
Technology Advancement: Ongoing technological improvements and infrastructure development within the AT ecosystem contribute to long-term price potential and market positioning.
Market Dynamics and Trading Activity
-
Leverage and Liquidation Events: Short-term price movements can be driven by liquidation events in leveraged trading positions. Recent analysis indicates that significant liquidation of long positions (78.5% of long liquidations) triggered a 24-hour price correction of -2.18%, demonstrating the impact of leverage on volatility.
-
Whale Positioning: Large holder sentiment remains constructive, with whale long-to-short ratios reaching 2.1581, reflecting strategic confidence in potential developments such as ETF approvals.
III. 2025-2030 AT Price Forecast
2025 Outlook
- Conservative Forecast: $0.06566 - $0.09120
- Base Case Forecast: $0.09120
- Optimistic Forecast: $0.13406 (requiring sustained market recovery and increased adoption)
2026-2028 Medium-term Perspective
- Market Stage Expectation: Gradual recovery and consolidation phase with potential for incremental growth as market sentiment stabilizes
- Price Range Predictions:
- 2026: $0.08560 - $0.16557 (23% upside potential)
- 2027: $0.09598 - $0.20030 (52% upside potential)
- 2028: $0.08825 - $0.21213 (85% upside potential)
- Key Catalysts: Ecosystem development expansion, institutional adoption acceleration, and positive regulatory clarity
2029-2030 Long-term Outlook
- Base Case Scenario: $0.15464 - $0.24819 (109% cumulative gain by 2029, assuming steady ecosystem maturation and mainstream acceptance)
- Optimistic Scenario: $0.19092 - $0.25907 (140% cumulative gain by 2030, contingent on breakthrough partnerships and significant network growth)
- Transformational Scenario: Exceeding $0.25907 by 2030 (under conditions of mainstream adoption, major technological breakthroughs, and favorable macroeconomic environment)
- 2030-12-31: AT at $0.25907 (entering mature growth phase with strengthened market position)
| 年份 | 预测最高价 | 预测平均价格 | 预测最低价 | 涨跌幅 |
|---|---|---|---|---|
| 2025 | 0.13406 | 0.0912 | 0.06566 | 0 |
| 2026 | 0.16557 | 0.11263 | 0.0856 | 23 |
| 2027 | 0.2003 | 0.1391 | 0.09598 | 52 |
| 2028 | 0.21213 | 0.1697 | 0.08825 | 85 |
| 2029 | 0.24819 | 0.19092 | 0.15464 | 109 |
| 2030 | 0.25907 | 0.21955 | 0.15808 | 140 |
APRO Token (AT) Professional Investment Strategy and Risk Management Report
I. Executive Summary
APRO Token (AT) is the native token of APRO, an AI-enhanced oracle infrastructure project supporting next-generation ecosystems across Real-World Assets (RWA), artificial intelligence, prediction markets, and decentralized finance (DeFi). As of December 20, 2025, AT is trading at $0.09131 with a market capitalization of $21.00 million and a fully diluted valuation of $91.31 million.
Key Metrics Overview:
- Current Price: $0.09131
- 24H Change: -3.58%
- Market Cap Rank: #850
- Circulating Supply: 230,000,000 AT (23% of total supply)
- Total Supply: 1,000,000,000 AT
- All-Time High: $0.5196 (November 2, 2025)
- All-Time Low: $0.07888 (December 17, 2025)
II. APRO Project Overview and AT Token Fundamentals
Project Background
APRO represents a decentralized data infrastructure solution designed to provide verified, real-time data across multiple asset categories:
- Coverage Scope: Crypto assets, equities, and real-world items
- Network Reach: 1,400+ data feeds across 40+ blockchains
- Core Strengths: Transparency, scalability, and data integrity
- Institutional Backing: Supported by Polychain Capital, Franklin Templeton, and YZi Labs
AT Token Specifications
| Parameter | Value |
|---|---|
| Token Standard | BEP-20 (Binance Smart Chain) |
| Contract Address | 0x9be61a38725b265bc3eb7bfdf17afdfc9d26c130 |
| Total Holders | 44,658 |
| Trading Pairs | 21 exchanges |
| 24H Trading Volume | $516,689.03 |
Market Positioning
AT holds market rank #850 with a market dominance of 0.0028%, indicating a micro-cap to small-cap positioning within the broader cryptocurrency ecosystem. The token's valuation remains significantly below its all-time high, presenting both recovery potential and downside risk considerations.
III. AT Price Performance Analysis
Historical Price Movements
Recent Performance:
- 1 Hour: +0.10% (+$0.000091)
- 24 Hours: -3.58% (-$0.00339)
- 7 Days: -7.96% (-$0.00790)
- 30 Days: -70.92% (-$0.22269)
- 1 Year: -8.95% (-$0.00898)
Price Range Analysis:
- 24H High: $0.09582
- 24H Low: $0.08906
- All-Time High: $0.5196 (Peak: November 2, 2025)
- All-Time Low: $0.07888 (Trough: December 17, 2025)
Market Sentiment and Volatility
The token exhibits significant volatility with a -70.92% decline over 30 days, indicating substantial recent correction from November peaks. The narrow 24-hour trading range ($0.08906-$0.09582) suggests current price consolidation, though current sentiment metrics remain neutral.
IV. AT Professional Investment Strategy and Risk Management
AT Investment Methodology
(1) Long-Term Hold Strategy
Suitable Investors:
- Investors with 2-5 year investment horizons
- Participants believing in APRO's oracle infrastructure thesis
- Portfolio diversification seekers within the DeFi/RWA ecosystem
Operational Recommendations:
-
Entry Strategy: Consider dollar-cost averaging (DCA) during periods of high volatility to reduce timing risk. Given the 70.92% decline over 30 days, averaging into positions near support levels may provide favorable entry points.
-
Position Sizing: Limit AT allocation to 1-3% of total cryptocurrency portfolio given micro-cap status and volatility profile. This ensures manageable downside exposure.
-
Security Protocol: For holdings exceeding $1,000 in value, utilize Gate.com's Web3 wallet for cold storage capabilities, or maintain custody through reputable institutional grade solutions with multi-signature protections.
(2) Active Trading Strategy
Technical Analysis Considerations:
-
Volatility Indicators: Given the 30-day decline of 70.92%, monitor RSI (Relative Strength Index) for oversold conditions (RSI < 30) as potential reversal signals. Current proximity to all-time lows may present contrarian trading opportunities.
-
Volume Analysis: Track 24-hour trading volume ($516,689) relative to historical averages. Breakouts accompanied by volume expansion above 150% of average daily volume warrant technical confirmation before position entry.
Wave-Trading Key Points:
-
Support Recognition: The recent all-time low of $0.07888 (December 17, 2025) establishes a critical support level. Trading strategies should factor bounces from this level.
-
Resistance Identification: Intermediate resistance exists at prior consolidation zones. The recent high of $0.09582 provides a near-term resistance level for swing traders targeting 5-10% gains.
AT Risk Management Framework
(1) Asset Allocation Principles
| Investor Profile | AT Allocation | Justification |
|---|---|---|
| Conservative | 0-1% | Suitable only as speculative allocation; core holdings should focus on established infrastructure tokens |
| Balanced | 1-3% | Acknowledges growth potential while limiting concentrated risk exposure |
| Aggressive | 3-5% | Accepts higher volatility for potential outsized returns; requires robust risk controls |
(2) Risk Hedging Strategies
-
Correlation Hedging: AT's micro-cap status means limited direct correlation with Bitcoin (BTC) or Ethereum (ETH). Investors should maintain core holdings in BTC/ETH (60-70% of crypto allocation) to create natural portfolio diversification against oracle-specific risks.
-
Position Scaling: Implement stop-loss orders at 15-20% below entry prices to protect against catastrophic loss scenarios. Given AT's 70.92% monthly decline, disciplined exit protocols remain essential.
(3) Secure Storage Solutions
-
Hot Wallet Option: For active trading positions, Gate.com Web3 wallet provides convenient access with browser-based security protocols. Recommended for positions under $1,000 or frequent trading activity.
-
Cold Storage Approach: For long-term holdings exceeding $1,000, transfer AT tokens to hardware-backed solutions with offline key storage. This eliminates smart contract and exchange compromise risks.
-
Security Considerations:
- Enable multi-factor authentication on Gate.com account
- Never share private keys or seed phrases
- Verify contract address (0x9be61a38725b265bc3eb7bfdf17afdfc9d26c130) before any transfers
- Use address whitelisting for recurring transfers
- Maintain updated backups of recovery phrases in physically secured locations
V. Potential Risks and Challenges
AT Market Risk
-
Liquidity Risk: With only $516,689 in 24-hour trading volume and micro-cap status, AT exhibits low liquidity. Large buy/sell orders could experience significant slippage, impacting execution prices for positions exceeding $50,000.
-
Volatility Concentration: The 70.92% decline over 30 days demonstrates extreme drawdown potential. Investors unprepared for 50%+ portfolio swings should avoid material AT allocation.
-
Speculative Dynamics: AT's current price (82% below all-time high) reflects potential overspeculation during November peaks followed by sharp corrections. Retail investor sentiment remains vulnerable to hype cycles.
AT Regulatory Risk
-
Token Classification Uncertainty: Depending on regulatory jurisdiction, oracle tokens may face security classification challenges. Adverse regulatory determinations could impact exchange listing status and token utility.
-
Geographic Restrictions: Certain jurisdictions may restrict access to AT trading or holding. Investors should verify local regulatory frameworks before position establishment.
-
Framework Evolution: Emerging DeFi regulations targeting oracle protocols could introduce compliance costs affecting APRO's competitive positioning.
AT Technical Risk
-
Smart Contract Exposure: AT operates on BSC (Binance Smart Chain) through BEP-20 standard. Any vulnerabilities in either the BSC network or APRO's smart contracts could compromise token security or functionality.
-
Data Feed Centralization: Despite decentralization claims, oracle protocols inherently depend on data provider reputation and honesty. Systemic data provider failures or manipulation could undermine APRO's value proposition.
-
Technological Obsolescence: Competing oracle solutions (though not mentioned in current project materials) could offer superior functionality, pricing, or security, rendering APRO's 1,400 data feeds insufficient for market share retention.
VI. Conclusion and Action Recommendations
AT Investment Value Assessment
APRO presents a specialized infrastructure play within the AI-enhanced oracle space. The project benefits from institutional backing (Polychain Capital, Franklin Templeton, YZi Labs) and addresses legitimate infrastructure needs across RWA, AI, and DeFi ecosystems. However, AT's current positioning reflects significant correction from speculative peaks.
Value Proposition:
- Positive: Diverse data infrastructure across 40+ blockchains; institutional credibility; growing relevance in RWA/DeFi markets
- Challenging: Micro-cap liquidity; extreme 30-day volatility (-70.92%); competitive oracle market; execution risk on promised functionality
AT Investment Recommendations
✅ Newcomers: Limit initial exploration to 0.5-1% portfolio allocation. Establish positions through dollar-cost averaging over 4-6 weeks rather than lump-sum purchases. Prioritize understanding oracle infrastructure fundamentals before capital commitment. Consider smaller first purchases on Gate.com to validate trading experience.
✅ Experienced Investors: Conduct technical analysis of support/resistance levels established near all-time lows. Implement disciplined stop-loss protocols at 15-20% below entry. Consider mean-reversion strategies given the dramatic 30-day decline. Evaluate AT within broader DeFi infrastructure allocation framework.
✅ Institutional Investors: Conduct comprehensive due diligence on APRO's technical architecture, data provider reputation mechanisms, and competitive differentiation. Evaluate AT as strategic allocation within alternative data infrastructure holdings. Consider custodian-grade storage through institutional-grade solutions.
AT Trading Participation Methods
-
Exchange Trading: Access AT through Gate.com spot trading market. Utilize limit orders to improve execution prices given low liquidity environment. Monitor order book depth before placing market orders.
-
Margin Trading: Gate.com margin trading allows leverage positions, though leverage should remain capped at 2-3x maximum for micro-cap volatility mitigation. Maintain vigilant monitoring given liquidation risk.
-
DCA Programs: Establish automated recurring purchases through Gate.com to systematize entry timing, reducing emotional decision-making during volatile periods.
Cryptocurrency investment carries extreme risk. This report does not constitute investment advice. Investors must conduct independent analysis and assess personal risk tolerance before capital commitment. Consult professional financial advisors for personalized guidance. Never invest funds you cannot afford to lose completely.
FAQ
What is the price prediction for AT&T?
AT&T (T) is expected to trade between $24.36 and $25.33 in 2025, with an average price of $25.10 based on current market analysis and trends.
What will AT&T stock be worth in 5 years?
AT&T's stock value in 5 years depends on company performance, market conditions, and economic factors. Based on current trends and analyst forecasts, the stock could range between $20-$30, but predictions remain uncertain and subject to significant market volatility.
What is the price prediction for ATA in 2025?
Based on technical analysis, ATA is predicted to reach approximately $0.155274 in 2025. This forecast considers market trends and technical indicators, though actual prices may vary based on market conditions.
What factors influence AT price predictions?
AT price predictions are influenced by market demand, trading volume, blockchain ecosystem developments, regulatory changes, macroeconomic conditions, and overall market sentiment in the crypto sector.
How accurate are AT price predictions?
AT price predictions typically show moderate accuracy, varying based on market conditions and analysis methods. Factors like volatility, trading volume, and market sentiment significantly impact prediction reliability. Most predictions range from 40-60% accuracy.
Share
Content
Introduction: AT's Market Position and Investment Value
I. AT Price History Review and Current Market Status
II. Core Factors Influencing AT's Future Price
III. 2025-2030 AT Price Forecast
I. Executive Summary
II. APRO Project Overview and AT Token Fundamentals
III. AT Price Performance Analysis
IV. AT Professional Investment Strategy and Risk Management
V. Potential Risks and Challenges
VI. Conclusion and Action Recommendations
FAQ
How to Buy Cryptocurrency


Trending Cryptocurrencies


2025 AT Price Prediction: Expert Analysis and Market Forecast for the Coming Year

2025 KAON Price Prediction: Analyzing Market Trends and Potential Growth Factors
What is ANLOG: Understanding the Analog-to-Digital Conversion Process in Modern Electronics

Is VELA AI (VELAAI) a good investment?: Analyzing the potential and risks of this emerging AI cryptocurrency

2025 VANA Price Prediction: Assessing the Future Value of this Emerging Cryptocurrency

2025 DEAI Price Prediction: Analyzing Market Trends and Potential Growth Factors

How to Stake Chainlink: A Step-by-Step Guide to LINK Staking

AlphaArena Model Launch: How AI is Redefining Crypto Trading with Real-World Benchmarks

How to Participate in Chainlink Airdrop

SpaceX Transfers $105 Million in Bitcoin to Unmarked Wallets

Why Do We Celebrate Bitcoin Pizza Day?