2025 APP Price Prediction: The Rising Costs of Digital Convenience in a Mobile-First World
Introduction: APP's Market Position and Investment Value
RWAX (APP), as an Injective-focused launchpad superapp, has integrated advanced on-chain trading bots since its inception. As of 2025, RWAX's market capitalization has reached $1,775,037, with a circulating supply of approximately 1,985,944,981 tokens, and a price hovering around $0.0008938. This asset, known for its innovative approach to on-chain trading, is playing an increasingly crucial role in the field of decentralized finance and trading automation.
This article will provide a comprehensive analysis of RWAX's price trends from 2025 to 2030, considering historical patterns, market supply and demand, ecosystem development, and macroeconomic factors to offer professional price predictions and practical investment strategies for investors.
I. APP Price History Review and Current Market Status
APP Historical Price Evolution
- 2024: APP launched with an initial price of $0.0067, reaching its all-time high of $0.051 on January 16th
- 2025: Market downturn, price declined significantly throughout the year
- November 2025: APP hit its all-time low of $0.000747 on November 4th
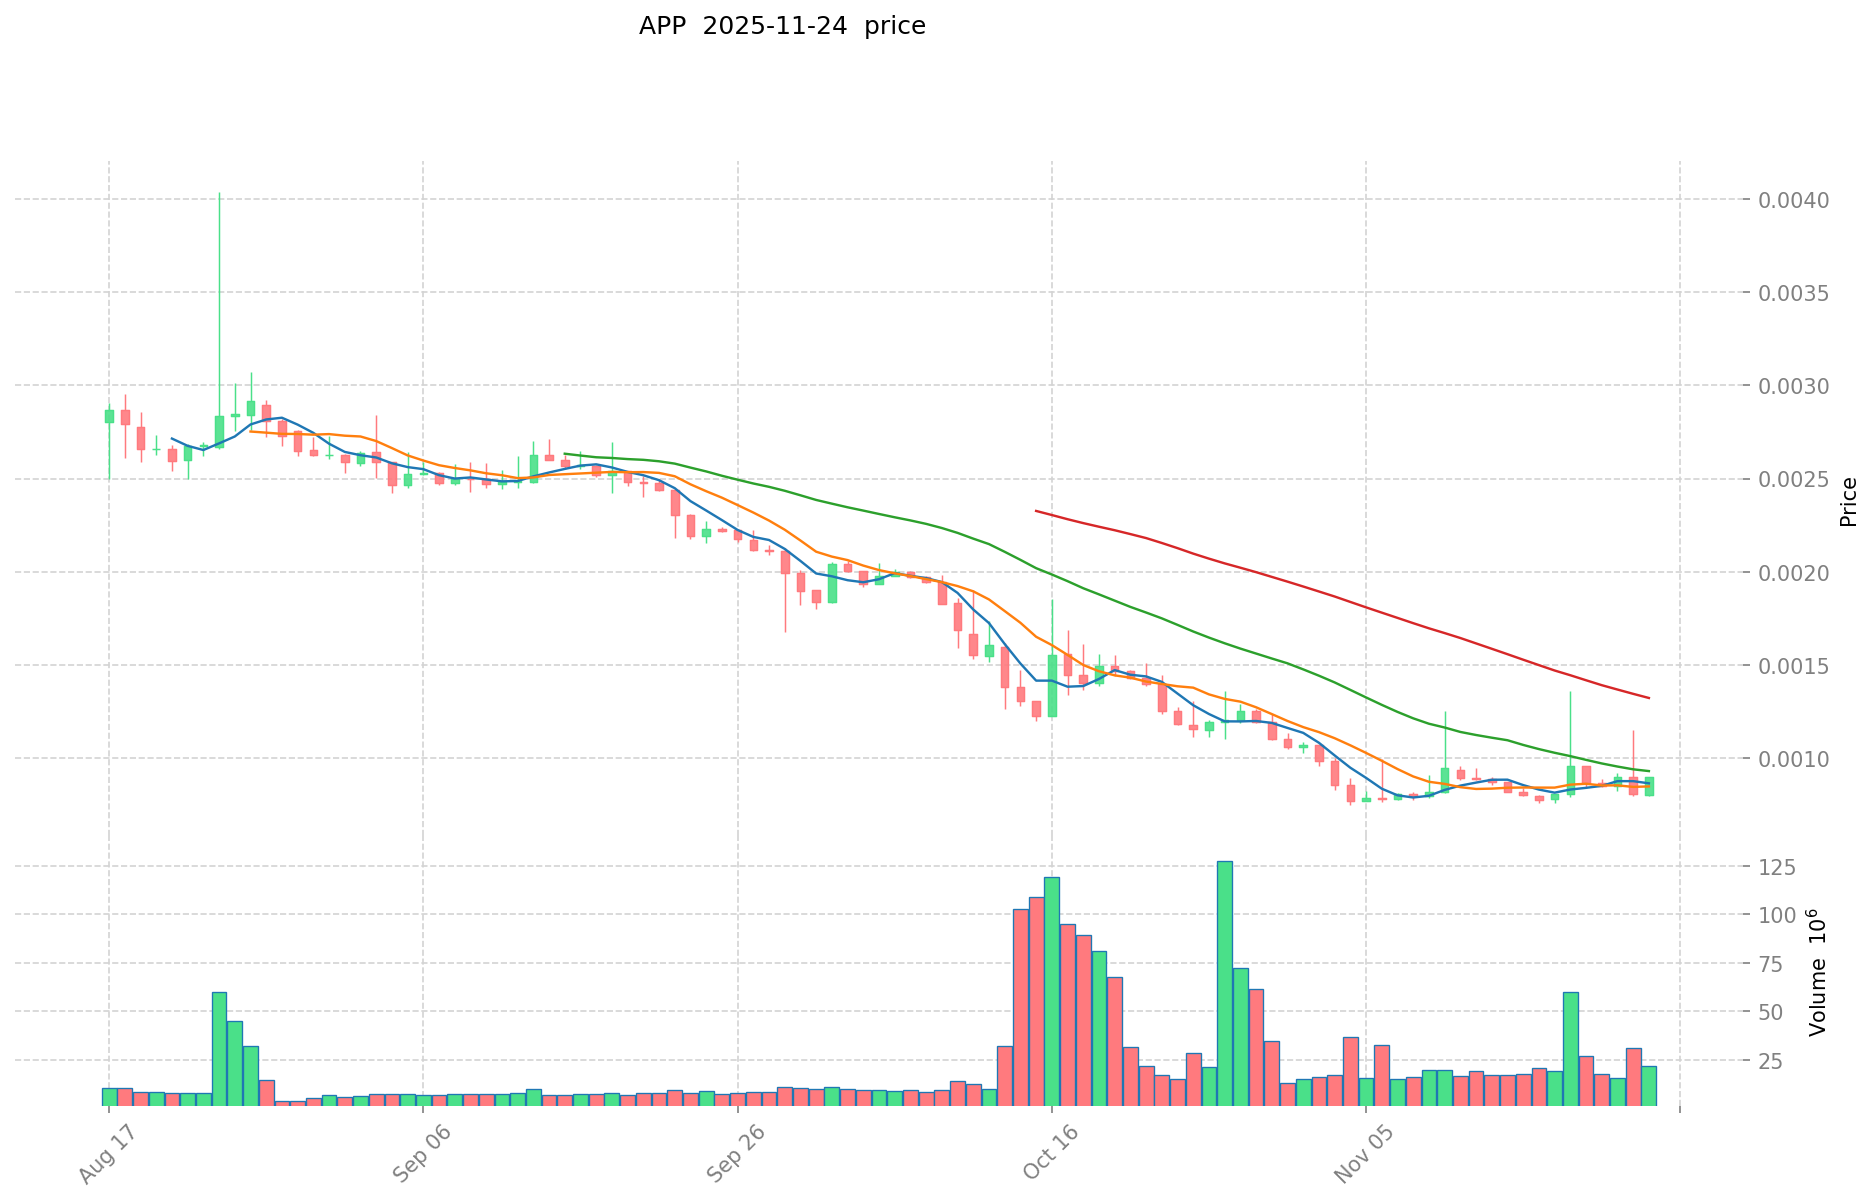
APP Current Market Situation
As of November 24, 2025, APP is trading at $0.0008938, showing a 7.1% increase in the last 24 hours. The token has experienced a notable recovery of 13.63% over the past week, despite being down 24.32% in the last 30 days. The current price represents a substantial 69.92% decrease from a year ago.
APP's market capitalization stands at $1,775,037, ranking 2222nd in the cryptocurrency market. The token's 24-hour trading volume is $18,784.99, indicating moderate market activity. With a circulating supply of 1,985,944,981.93 APP tokens out of a total supply of 3 billion, the circulating supply ratio is approximately 66.2%.
The token's price is currently closer to its all-time low than its all-time high, suggesting a challenging market environment. However, the recent short-term price increases could indicate a potential trend reversal or temporary market optimism.
Click to view the current APP market price
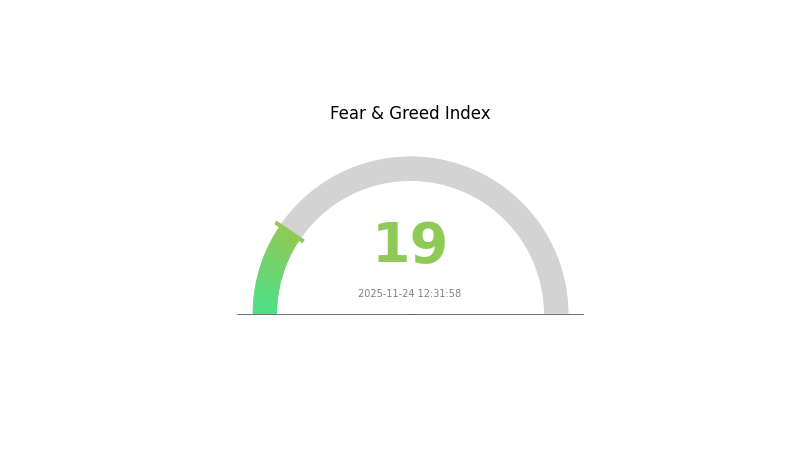
APP Market Sentiment Indicator
2025-11-24 Fear and Greed Index: 19 (Extreme Fear)
Click to view the current Fear & Greed Index
The crypto market is currently gripped by extreme fear, with the Fear and Greed Index plummeting to 19. This significant drop indicates widespread anxiety among investors, potentially driven by recent market volatility or negative news. During such periods of extreme fear, contrarian investors often view it as a potential buying opportunity, adhering to Warren Buffett's advice to "be fearful when others are greedy, and greedy when others are fearful." However, caution is advised as market sentiment can shift rapidly.
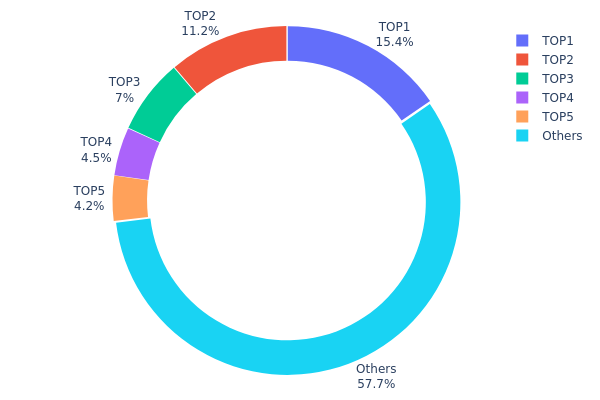
APP Holdings Distribution
The address holdings distribution data reveals significant concentration among the top holders of APP tokens. The top 5 addresses collectively control 42.29% of the total supply, with the largest holder possessing 15.39% of all tokens. This level of concentration suggests a relatively centralized ownership structure, which could have implications for market dynamics and token governance.
The substantial holdings by a few large addresses may indicate the presence of major stakeholders or institutional investors. While this can provide stability, it also raises concerns about potential market manipulation and price volatility. The concentration of tokens in these top addresses could allow for significant market influence, potentially affecting liquidity and price movements. However, it's worth noting that 57.71% of tokens are distributed among other addresses, which provides some level of decentralization and may help mitigate risks associated with excessive concentration.
Overall, this distribution pattern reflects a market structure with a notable degree of centralization, which could impact the token's stability and governance processes. Investors and stakeholders should monitor these large holdings for any significant changes that might affect the token's ecosystem and market behavior.
Click to view the current APP Holdings Distribution
| Top | Address | Holding Qty | Holding (%) |
|---|---|---|---|
| 1 | 0xc882...84f071 | 461838.58K | 15.39% |
| 2 | 0x5ddd...cc6cfb | 336000.00K | 11.20% |
| 3 | 0xe190...170182 | 210000.00K | 7.00% |
| 4 | 0xe459...c5d02f | 135000.03K | 4.50% |
| 5 | 0x183c...62f59a | 126000.00K | 4.20% |
| - | Others | 1731161.39K | 57.71% |
II. Core Factors Affecting the Future Price of APP
Supply Mechanism
- Total Supply: The total supply of PARTI is 1 billion tokens, with 23.3% (233 million) currently in circulation.
- Historical Pattern: Supply changes have historically influenced price movements.
- Current Impact: The circulation is expected to increase gradually until 2026, which may affect the price dynamics.
Institutional and Whale Dynamics
- Enterprise Adoption: Some notable companies have begun adopting blockchain technologies, potentially impacting market demand.
- National Policies: Government regulations and policies regarding cryptocurrencies are evolving, which could significantly influence market sentiment and adoption rates.
Macroeconomic Environment
- Monetary Policy Impact: Central bank policies, particularly regarding interest rates and quantitative easing, are expected to influence crypto markets.
- Inflation Hedging Properties: In inflationary environments, some cryptocurrencies have shown potential as hedging assets.
- Geopolitical Factors: International tensions and trade conflicts may impact global economic stability and, consequently, cryptocurrency markets.
Technological Development and Ecosystem Building
- AI Integration: The integration of artificial intelligence in blockchain technologies is expected to drive innovation and potentially impact token valuations.
- Ecosystem Applications: The development of DApps and other ecosystem projects will likely play a crucial role in determining the long-term value and utility of the token.
III. APP Price Prediction for 2025-2030
2025 Outlook
- Conservative forecast: $0.00068 - $0.00089
- Neutral forecast: $0.00089 - $0.00108
- Optimistic forecast: $0.00108 - $0.00128 (requires favorable market conditions)
2027-2028 Outlook
- Market phase expectation: Potential growth phase
- Price range forecast:
- 2027: $0.00098 - $0.00140
- 2028: $0.00068 - $0.00163
- Key catalysts: Increased adoption and technological advancements
2029-2030 Long-term Outlook
- Base scenario: $0.00127 - $0.00158 (assuming steady market growth)
- Optimistic scenario: $0.00158 - $0.00185 (assuming strong market performance)
- Transformative scenario: $0.00185 - $0.00199 (assuming breakthrough innovations and widespread adoption)
- 2030-12-31: APP $0.00199 (potential peak price)
| 年份 | 预测最高价 | 预测平均价格 | 预测最低价 | 涨跌幅 |
|---|---|---|---|---|
| 2025 | 0.00128 | 0.00089 | 0.00068 | 0 |
| 2026 | 0.00125 | 0.00109 | 0.00086 | 21 |
| 2027 | 0.0014 | 0.00117 | 0.00098 | 30 |
| 2028 | 0.00163 | 0.00128 | 0.00068 | 43 |
| 2029 | 0.00171 | 0.00146 | 0.00127 | 63 |
| 2030 | 0.00199 | 0.00158 | 0.00089 | 76 |
IV. APP Professional Investment Strategies and Risk Management
APP Investment Methodology
(1) Long-term Holding Strategy
- Suitable for: Risk-tolerant investors with a long-term perspective
- Operation suggestions:
- Accumulate APP tokens during market dips
- Regularly review project developments and adjust holdings accordingly
- Store tokens in a secure hardware wallet
(2) Active Trading Strategy
- Technical analysis tools:
- Moving Averages: Use to identify trends and potential entry/exit points
- Relative Strength Index (RSI): Monitor overbought/oversold conditions
- Key points for swing trading:
- Set clear stop-loss and take-profit levels
- Monitor Injective ecosystem developments for potential catalysts
APP Risk Management Framework
(1) Asset Allocation Principles
- Conservative investors: 1-3% of crypto portfolio
- Aggressive investors: 5-10% of crypto portfolio
- Professional investors: Up to 15% of crypto portfolio
(2) Risk Hedging Solutions
- Diversification: Spread investments across multiple DeFi projects
- Stop-loss orders: Implement to limit potential losses
(3) Secure Storage Solutions
- Hot wallet recommendation: Gate web3 wallet
- Cold storage solution: Use hardware wallets for long-term holdings
- Security precautions: Enable two-factor authentication, use unique passwords
V. APP Potential Risks and Challenges
APP Market Risks
- High volatility: APP token price may experience significant fluctuations
- Competition: Other DeFi projects may outperform Moon App
- Liquidity risk: Low trading volume may impact ability to enter/exit positions
APP Regulatory Risks
- Regulatory uncertainty: Changing regulations may impact DeFi projects
- Compliance issues: Moon App may face challenges adapting to new regulations
- Cross-border restrictions: International regulatory differences may limit adoption
APP Technical Risks
- Smart contract vulnerabilities: Potential for exploits or hacks
- Scalability challenges: Injective network congestion could affect performance
- Integration risks: Issues with third-party protocols could impact functionality
VI. Conclusion and Action Recommendations
APP Investment Value Assessment
APP presents a high-risk, high-reward opportunity within the DeFi space. Long-term value lies in Moon App's innovative features and Injective ecosystem growth, but short-term volatility and market risks remain significant.
APP Investment Recommendations
✅ Beginners: Start with small positions, focus on learning DeFi fundamentals ✅ Experienced investors: Consider allocating a portion of DeFi portfolio to APP ✅ Institutional investors: Conduct thorough due diligence, potentially include in diversified DeFi fund
APP Trading Participation Methods
- Spot trading: Purchase APP tokens on Gate.com
- Limit orders: Set buy/sell orders at specific price levels
- DCA strategy: Regularly invest small amounts to average out price volatility
Cryptocurrency investments carry extremely high risks, and this article does not constitute investment advice. Investors should make decisions carefully based on their own risk tolerance and are advised to consult professional financial advisors. Never invest more than you can afford to lose.
FAQ
Is APP a good stock to buy?
Yes, APP appears to be a good stock to buy. With a P/E ratio under 20, it's generally considered favorable for investment. The company shows solid financial indicators, suggesting potential for growth and returns.
Will AAP stock go up?
Yes, AAP stock is projected to rise. By 2050, it's expected to reach $89.95, representing an 80.77% increase from its current price.
How high will AppLovin stock go?
AppLovin stock is projected to reach up to $860.00, with an average target of 32.44% above the last closing price, based on current market forecasts.
What is the target price for AppLovin 2025?
The target price for AppLovin in 2025 is projected to be $552.22, based on forecasts for November 25, 2025.
Share
Content
Introduction: APP's Market Position and Investment Value
I. APP Price History Review and Current Market Status
II. Core Factors Affecting the Future Price of APP
III. APP Price Prediction for 2025-2030
IV. APP Professional Investment Strategies and Risk Management
V. APP Potential Risks and Challenges
VI. Conclusion and Action Recommendations
FAQ

