2025 AGRI Price Prediction: Analyzing Market Trends and Future Prospects for Agricultural Commodities
Introduction: AGRI's Market Position and Investment Value
Agridex (AGRI), as a blockchain-powered digital platform revolutionizing agricultural trade, has been enhancing transparency, sustainability, and financial inclusivity since its inception. As of 2025, AGRI's market capitalization has reached $3,494,000, with a circulating supply of approximately 1,000,000,000 tokens, and a price hovering around $0.003494. This asset, known as the "AgriTech Innovator," is playing an increasingly crucial role in transforming the agricultural supply chain and cross-border payments.
This article will comprehensively analyze AGRI's price trends from 2025 to 2030, combining historical patterns, market supply and demand, ecosystem development, and macroeconomic factors to provide investors with professional price forecasts and practical investment strategies.
I. AGRI Price History Review and Current Market Status
AGRI Historical Price Evolution
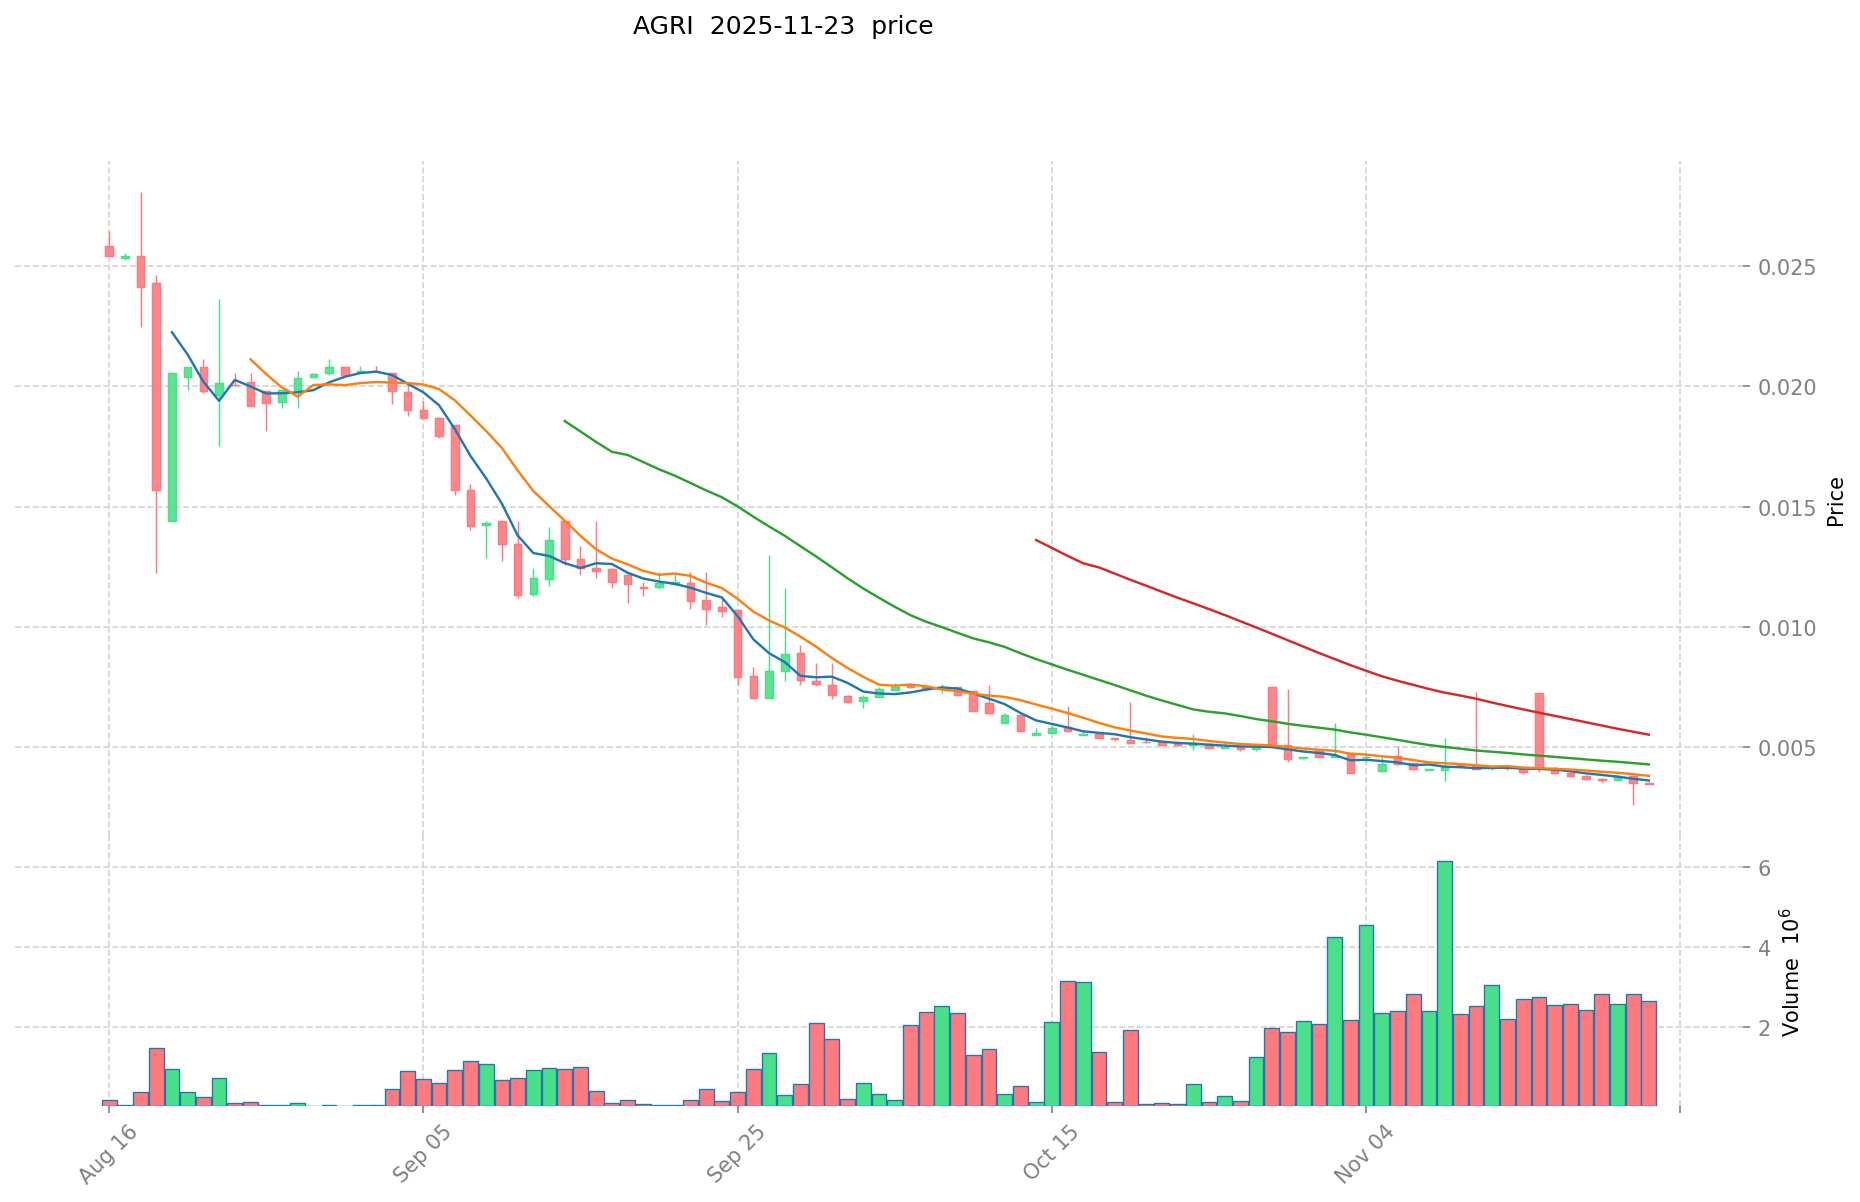
- 2024: Project launch, price peaked at $0.17876 on December 13
- 2025: Significant market correction, price dropped to an all-time low of $0.002593 on November 21
AGRI Current Market Situation
As of November 23, 2025, AGRI is trading at $0.003494. The token has experienced a slight recovery of 0.8% in the past hour but remains down 0.48% over the last 24 hours. The weekly and monthly trends show more substantial declines of 14.66% and 29.080% respectively. Compared to its all-time high of $0.17876 reached in December 2024, AGRI has seen a dramatic decrease of 96.45% over the past year.
The current market capitalization of AGRI stands at $3,494,000, with a circulating supply of 1,000,000,000 tokens, which is also the total and maximum supply. The 24-hour trading volume is relatively low at $9,473.71, indicating limited liquidity in the market.
AGRI's market dominance is currently at 0.00011%, suggesting it is a small-cap token in the broader cryptocurrency market. The fully diluted valuation matches the market cap, as all tokens are in circulation.
Click to view the current AGRI market price

AGRI Market Sentiment Indicator
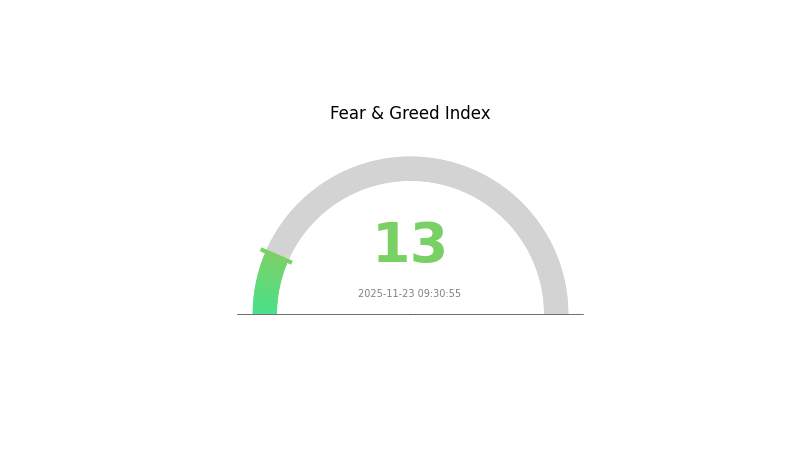
2025-11-23 Fear and Greed Index: 13 (Extreme Fear)
Click to view the current Fear & Greed Index
The crypto market is currently experiencing a state of extreme fear, with the Fear and Greed Index plummeting to 13. This suggests investors are highly cautious and risk-averse. Such extreme fear often precedes potential buying opportunities, as assets may be undervalued. However, it's crucial to conduct thorough research and exercise caution before making any investment decisions. Remember, market sentiment can shift rapidly, and past performance doesn't guarantee future results. Stay informed and consider diversifying your portfolio to manage risk effectively.

AGRI Holdings Distribution
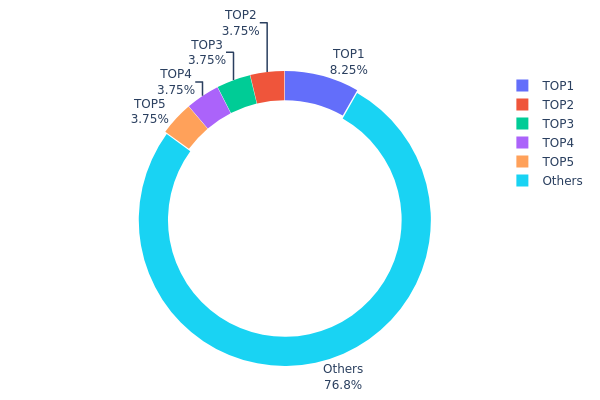
The address holdings distribution chart for AGRI reveals a moderately concentrated ownership structure. The top address holds 8.24% of the total supply, while the next four largest addresses each control 3.75%. Collectively, these top five addresses account for 23.24% of AGRI tokens, with the remaining 76.76% distributed among other holders.
This distribution pattern suggests a relatively balanced market structure for AGRI. While there is some concentration at the top, it is not excessive, as no single address holds a dominant position. The presence of four addresses with equal holdings (3.75% each) could indicate strategic allocations or early investor positions. However, the fact that over three-quarters of the tokens are held by smaller addresses points to a healthy level of decentralization.
This distribution may contribute to market stability, as no single entity has overwhelming control to manipulate prices. Nevertheless, coordinated actions by the top holders could still impact short-term price movements. Overall, the AGRI token distribution reflects a maturing market with a good balance between larger stakeholders and a diverse base of smaller holders, potentially fostering long-term ecosystem growth and resilience.
Click to view the current AGRI Holdings Distribution

| Top | Address | Holding Qty | Holding (%) |
|---|---|---|---|
| 1 | Ki27JW...kuRg6Z | 82458.22K | 8.24% |
| 2 | yuuhuj...5AxkxE | 37500.00K | 3.75% |
| 3 | 5THcu3...b1U8tj | 37500.00K | 3.75% |
| 4 | 6mJc8j...Wb3sGt | 37500.00K | 3.75% |
| 5 | 8GynMA...6GCDSr | 37500.00K | 3.75% |
| - | Others | 767541.05K | 76.76% |
II. Core Factors Affecting AGRI's Future Price
Supply Mechanism
- Emission Schedule: AGRI follows a predetermined emission schedule with periodic reductions in supply.
- Historical Pattern: Previous supply reductions have generally led to upward price pressure.
- Current Impact: The upcoming supply reduction is expected to create scarcity and potentially drive prices higher.
Macroeconomic Environment
- Inflation Hedging Properties: AGRI has shown some resilience as a potential hedge against inflation in agricultural markets.
Technical Development and Ecosystem Building
- Ecosystem Applications: AGRI is utilized in various DApps and projects focused on agricultural supply chain management and commodities trading.
III. AGRI Price Prediction for 2025-2030
2025 Outlook
- Conservative prediction: $0.00307 - $0.00353
- Neutral prediction: $0.00353 - $0.00370
- Optimistic prediction: $0.00370 - $0.00388 (requires positive market sentiment)
2027-2028 Outlook
- Market phase expectation: Potential growth phase
- Price range forecast:
- 2027: $0.00234 - $0.00564
- 2028: $0.00455 - $0.00488
- Key catalysts: Increased adoption, technological advancements
2029-2030 Long-term Outlook
- Base scenario: $0.00481 - $0.00536 (assuming steady market growth)
- Optimistic scenario: $0.00591 - $0.00702 (assuming strong market performance)
- Transformative scenario: $0.00702+ (assuming breakthrough innovations and widespread adoption)
- 2030-12-31: AGRI $0.00702 (potential peak price)
| 年份 | 预测最高价 | 预测平均价格 | 预测最低价 | 涨跌幅 |
|---|---|---|---|---|
| 2025 | 0.00388 | 0.00353 | 0.00307 | 0 |
| 2026 | 0.00396 | 0.0037 | 0.00352 | 6 |
| 2027 | 0.00564 | 0.00383 | 0.00234 | 9 |
| 2028 | 0.00488 | 0.00474 | 0.00455 | 35 |
| 2029 | 0.00591 | 0.00481 | 0.00437 | 37 |
| 2030 | 0.00702 | 0.00536 | 0.0045 | 53 |
IV. AGRI Professional Investment Strategies and Risk Management
AGRI Investment Methodology
(1) Long-term Holding Strategy
- Suitable for: Investors interested in agricultural technology and blockchain innovations
- Operation suggestions:
- Accumulate AGRI tokens during market dips
- Monitor AgriDex platform developments and adoption rates
- Store tokens in secure wallets with private key control
(2) Active Trading Strategy
- Technical analysis tools:
- Moving Averages: Use to identify trends and potential reversal points
- Relative Strength Index (RSI): Helps in determining overbought or oversold conditions
- Key points for swing trading:
- Set clear entry and exit points based on technical indicators
- Keep track of AgriDex ecosystem news and updates
AGRI Risk Management Framework
(1) Asset Allocation Principles
- Conservative investors: 1-3% of crypto portfolio
- Aggressive investors: 5-10% of crypto portfolio
- Professional investors: Up to 15% of crypto portfolio
(2) Risk Hedging Solutions
- Diversification: Spread investments across different agricultural-focused crypto projects
- Stop-loss orders: Implement to limit potential losses
(3) Secure Storage Solutions
- Hot wallet recommendation: Gate Web3 Wallet
- Cold storage solution: Hardware wallets for long-term holdings
- Security precautions: Enable two-factor authentication, use strong passwords, and regularly update software
V. AGRI Potential Risks and Challenges
AGRI Market Risks
- High volatility: AGRI price may experience significant fluctuations
- Limited liquidity: Potential challenges in executing large trades without impacting price
- Market sentiment: Susceptible to overall crypto market trends
AGRI Regulatory Risks
- Uncertain regulatory landscape: Potential changes in cryptocurrency regulations
- Cross-border compliance: Challenges in adhering to various international agricultural trade laws
- Financial reporting requirements: Possible increased scrutiny on blockchain-based agricultural platforms
AGRI Technical Risks
- Smart contract vulnerabilities: Potential bugs or exploits in the underlying code
- Scalability challenges: Possible limitations in handling increased transaction volumes
- Interoperability issues: Difficulties in integrating with traditional agricultural systems
VI. Conclusion and Action Recommendations
AGRI Investment Value Assessment
AGRI presents a unique opportunity in the intersection of blockchain and agriculture. While it offers potential for long-term growth due to its innovative approach to agricultural trade, short-term volatility and adoption challenges pose significant risks.
AGRI Investment Recommendations
✅ Beginners: Consider small, incremental investments to gain exposure while learning about the project ✅ Experienced investors: Implement a dollar-cost averaging strategy and actively monitor project developments ✅ Institutional investors: Conduct thorough due diligence and consider AGRI as part of a diversified crypto portfolio
AGRI Trading Participation Methods
- Spot trading: Buy and sell AGRI tokens on Gate.com
- Staking: Participate in Staking programs if offered by the AgriDex platform
- Ecosystem participation: Engage with the AgriDex platform to understand its real-world applications
Cryptocurrency investments carry extremely high risks, and this article does not constitute investment advice. Investors should make decisions carefully based on their own risk tolerance and are advised to consult professional financial advisors. Never invest more than you can afford to lose.
FAQ
Is agri a good investment?
Yes, AGRI shows potential for growth in the Web3 space. Its innovative approach to agriculture and blockchain integration makes it an attractive investment option for 2025 and beyond.
Is arx a good buy now?
Yes, ARX looks promising. Its innovative tech and growing adoption suggest potential for significant gains in the near future.
Is AgriFORCE a buy or sell?
Based on current market trends and potential growth in the agtech sector, AgriFORCE could be considered a buy. However, investors should conduct their own research before making any investment decisions.
Why is agri stock up?
AGRI stock is up due to increased demand for agricultural commodities, positive market sentiment, and potential innovations in farming technology.
Share
Content