
Key Takeaways
-
OriginTrail (TRAC) has surged around 12% in a single day, drawing renewed attention to the token.
-
TRAC has broken out from an ascending triangle near $0.46 on the daily chart, signaling growing bullish momentum.
-
Similar breakout structures in July and October 2025 previously led to strong rallies of 63% and 113%.
-
Holding the $0.44–$0.46 zone as support will be crucial to keep the bullish fractal setup intact.
-
If the pattern plays out, TRAC could attempt a move toward its long-term ascending resistance above $1.00.
OriginTrail, the decentralized knowledge graph protocol, is stepping back into the spotlight as its native token TRAC records a strong 12% daily surge. Beyond the price jump, the real signal is coming from the charts, where a familiar fractal breakout structure is starting to emerge on the daily timeframe, hinting that a larger upside move could be forming.
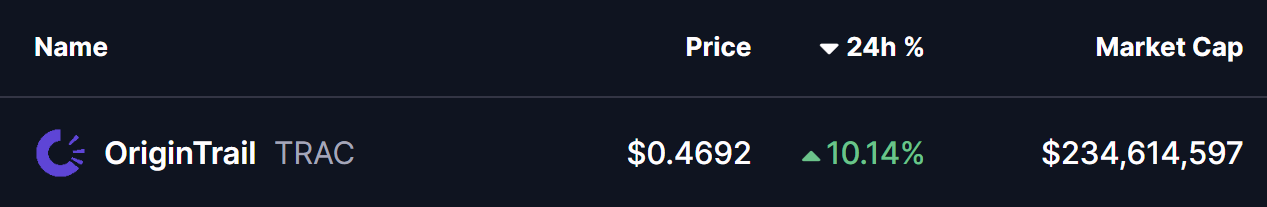
Source: Coinmarketcap
Fractal Breakout Hints at Potential Upside Move
On the daily chart, TRAC has confirmed a breakout from an ascending triangle pattern near the $0.46 level. This breakout is particularly important as price is now trading just above the 200-day moving average, a level that has historically acted as a major trend-defining zone for TRAC.
What makes this setup more compelling is its similarity to previous breakout phases. In late July 2025, a comparable structure resulted in a 63% upside move after price held above its breakout base. Later, in early October 2025, TRAC broke out from a right-angled descending broadening wedge pattern. That move was followed by a reclaim of the 200-day moving average and ultimately led to a powerful 113% rally.
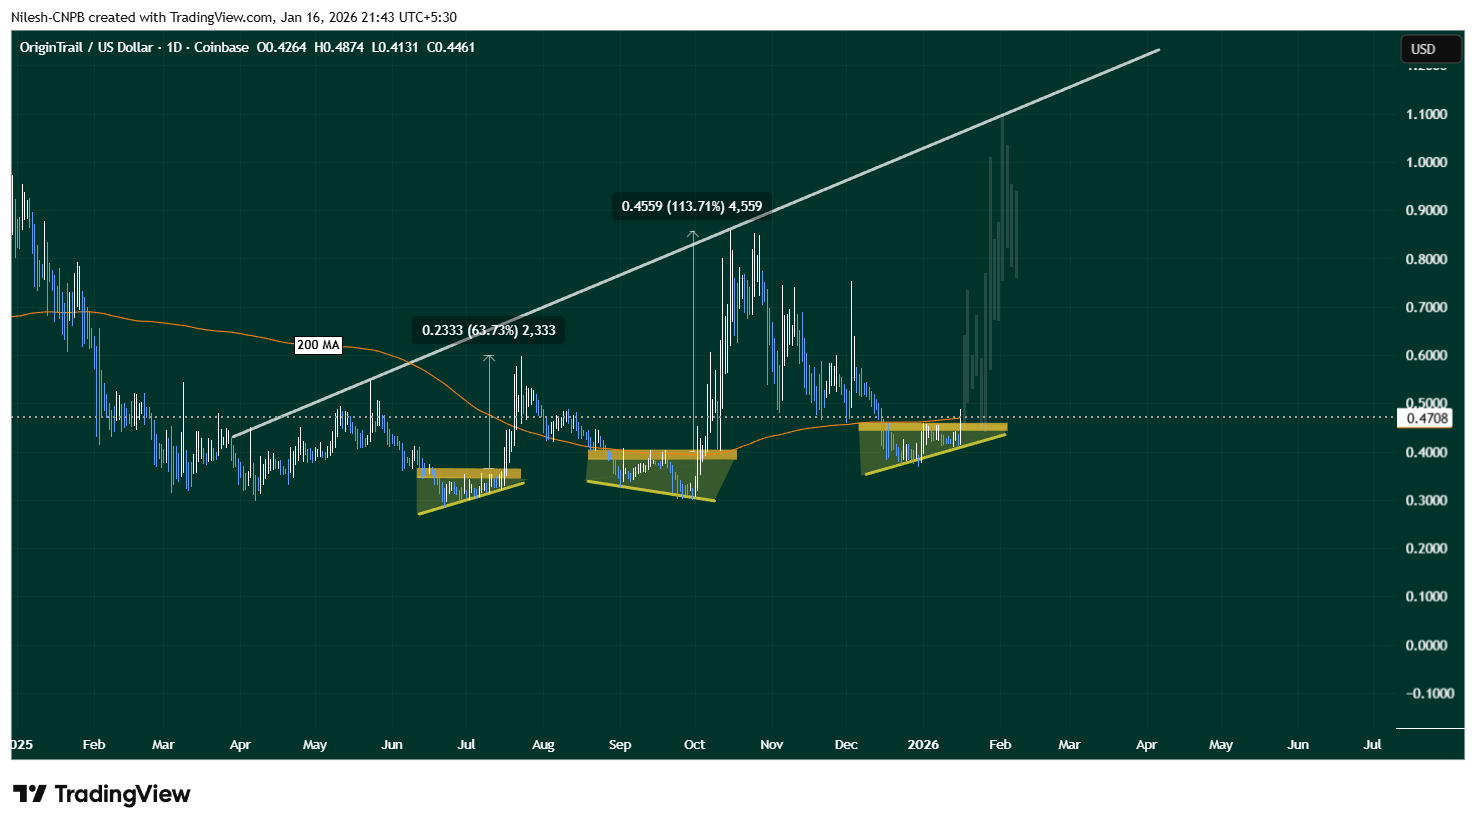
OriginTrail (TRAC) Daily Chart/Coinsprobe (Source: Tradingview)
The current setup shares key characteristics with those earlier moves. Price compression, a clean breakout, and interaction with the 200-day MA suggest that TRAC may once again be transitioning from consolidation into expansion.
What’s Next for TRAC?
If this fractal breakout plays out as expected, holding the $0.44–$0.46 zone as support will be crucial. A sustained hold above this range, along with continued strength above the 200-day moving average, could act as a launchpad for further upside.
In that scenario, TRAC may attempt a move toward its long-term ascending resistance trendline, which currently sits above the $1.00 level. A push toward that zone would align closely with the magnitude of prior fractal-driven rallies seen on the chart.
That said, fractal patterns are never guarantees. Broader market conditions, liquidity, and overall sentiment will continue to influence price action. A failure to hold the $0.44–$0.46 support zone or a rejection back below the 200-day moving average could invalidate the breakout and weaken the bullish fractal thesis.
Bottom Line
TRAC is showing early signs of another technically significant breakout, supported by historical fractal behavior and a reclaim of a key long-term moving average. If buyers can defend the current support zone, the chart suggests that OriginTrail may be positioning itself for a larger upside move in the weeks ahead.
Disclaimer: The views and analysis presented in this article are for informational purposes only and reflect the author’s perspective, not financial advice. Technical patterns and indicators discussed are subject to market volatility and may or may not yield the anticipated results. Investors are advised to exercise caution, conduct independent research, and make decisions aligned with their individual risk tolerance.
About Author: Nilesh Hembade is the Founder and Lead Author of Coinsprobe, with over 5 years of experience in the cryptocurrency and blockchain industry. Since launching Coinsprobe in 2023, he has been providing daily, research-driven insights through in-depth market analysis, on-chain data, and technical research.
Disclaimer: The information on this page may come from third parties and does not represent the views or opinions of Gate. The content displayed on this page is for reference only and does not constitute any financial, investment, or legal advice. Gate does not guarantee the accuracy or completeness of the information and shall not be liable for any losses arising from the use of this information. Virtual asset investments carry high risks and are subject to significant price volatility. You may lose all of your invested principal. Please fully understand the relevant risks and make prudent decisions based on your own financial situation and risk tolerance. For details, please refer to
Disclaimer.
Gerelateerde artikelen
7-Day AI Coin Performance Explodes — Are These 5 Tokens Worth Buying Right Now?
These tokens’ weekly performance reflects different degrees of stability, speculation, and maturity.
Social factors and interactions also contributed to short-term price dynamics.
Those with larger ecosystems appear to have more stable price movements than highly volatile assets.
There h
CryptoNewsLand4u geleden
川普暫緩中東特使的磋商行程、比特幣受地緣政治波動小幅回落
美國總統川普宣布取消中東特使威特科夫與庫許納前往巴基斯坦的行程,強調美方掌握談判主導權;比特幣因消息短線回落,分析師認為為地緣風險溢價所致,市場焦點轉向棕櫚海灘加密貨幣會議與未來監管動向。
ChainNewsAbmedia4u geleden
SUI Price Eyes $1.10 Breakout as Whale Positions Rise
Key Insights
SUI trades at $0.96 with RSI at 53.66, showing neutral momentum while maintaining upside room for expansion toward resistance levels.
Whale positioning at 70% long signals strong institutional confidence, aligning with rising open interest and steady capital inflows despite
CryptoNewsLand7u geleden
PEPE Price Climbs as Bulls Test Key Resistance Breakout
Key Insights
Pepe’s price rises for three days as improving sentiment boosts retail demand, supported by stronger participation and steady gains in futures open interest.
Futures open interest climbs above $213 million, signaling growing trader confidence as rising positions align with
CryptoNewsLand7u geleden
BNB Price Steady Above $633 as Bulls Face Strong Barriers
Key Insights:
BNB holds above the 50-day EMA near $633, supported by whale activity, while mixed derivatives data keep price action within a consolidation range.
Technical indicators, including RSI and MACD, show mild bullish momentum, though strong resistance levels near $662 and $680
CryptoNewsLand8u geleden
Solana Eyes $87 Breakout as Bullish Signals Strengthen
Solana sits near key resistance around $87 as on-chain activity and positive funding buoy bullish momentum; whale-led demand in derivatives supports a potential breakout. RSI >50 and positive MACD indicate rising upside, with a path toward $92–$97 and support near $77.
CryptoNewsLand8u geleden