The 2025 Christmas market completely failed, with Bitcoin struggling around $87,110. Analysts point out that Bitcoin’s current pattern is almost identical to the 2021 bull market top. After reaching a peak of $51,700 on December 24 that year, it plummeted 34% within a month. If the same pattern repeats, Bitcoin could fall to $70,000 in January. However, the “Mini Bat” pattern may indicate a super cycle brewing rather than a prolonged bear market.
Historical Data Reveals the Cruel Truth of Christmas Market
The Christmas market was once a romantic legend in the crypto world, but data from 2025 has completely shattered this myth. Bitcoin only rose 0.33% on December 24, far below its historical performance during the same period. Looking back at previous cycles, Bitcoin hit a record high of $19,783 on Christmas Eve 2017, and in 2020, it broke through $24,000 during Christmas, kickstarting a bull run. But the 2021 Christmas market was a trap.
On December 24, 2021, Bitcoin reached a zone high of $51,700, leading many investors to believe it was a breakout prelude. The result was a 34% crash within a month, directly destroying leveraged longs. The triggers for this collapse included the Fed turning hawkish, institutional profit-taking, and a double top technical pattern confirmation. The 2025 situation bears startling similarities: the Fed suspending rate cut expectations, slowing ETF capital inflows, and prices repeatedly testing and failing at key resistance levels.
Even more concerning is that the 2025 Christmas market failure occurred amid unprecedented institutional participation. Spot ETFs hold over 1 million BTC, which should provide strong support in theory, yet prices remain weak. This divergence suggests that institutional capital inflow has slowed or even turned net outflow. When institutions dominate, markets become highly sensitive to macroeconomic data and policy signals, yet these catalysts are absent during Christmas.
Fractal Analysis Warning: The 2021 Crash Script Is Repeating
Technical analysts on platform X have sparked a “fractal craze,” comparing current price movements with those of December 2021 frame by frame. Fractal analysis is a technique used to identify recurring patterns in historical prices across different timeframes. While it doesn’t guarantee future trends, it offers important risk warnings. Current similarities include: RSI forming bearish divergence at similar levels, volume shrinking at high levels, and false breakouts before actual breakouts.
A popular analyst on X pointed out that, based on the sell-off speed of 2021, today’s price could drop to $70,000. This prediction is based on Fibonacci retracement levels and historical volatility data. $70,000 aligns with the 50-day moving average and the lower boundary of previous consolidation zones. Falling below could open deeper correction space. Kaleo also expressed a similar view, believing current market conditions resemble fall 2020— the last deep shakeout before a real bull market explosion.
2021 vs 2025 Key Similarities
Price Structure: Double top or multiple top formations, with peaks gradually decreasing
Volume Characteristics: Diminishing volume during rallies, increasing volume during declines
Market Sentiment: Extreme greed index peaks followed by rapid decline
Macro Environment: Central bank policy shift towards tightening expectations
Institutional Behavior: Large holders start to reduce positions gradually
However, the limitations of fractal analysis must also be acknowledged. The market structure in 2025 is already fundamentally different from 2021. The presence of ETFs has altered capital flow pathways, and increased transparency of institutional holdings makes panic selling less likely to trigger. Additionally, the current regulatory environment is relatively friendly, and a crypto-friendly Trump administration could provide support at critical moments.
Mini Bat Pattern: The Prelude to a Super Cycle?
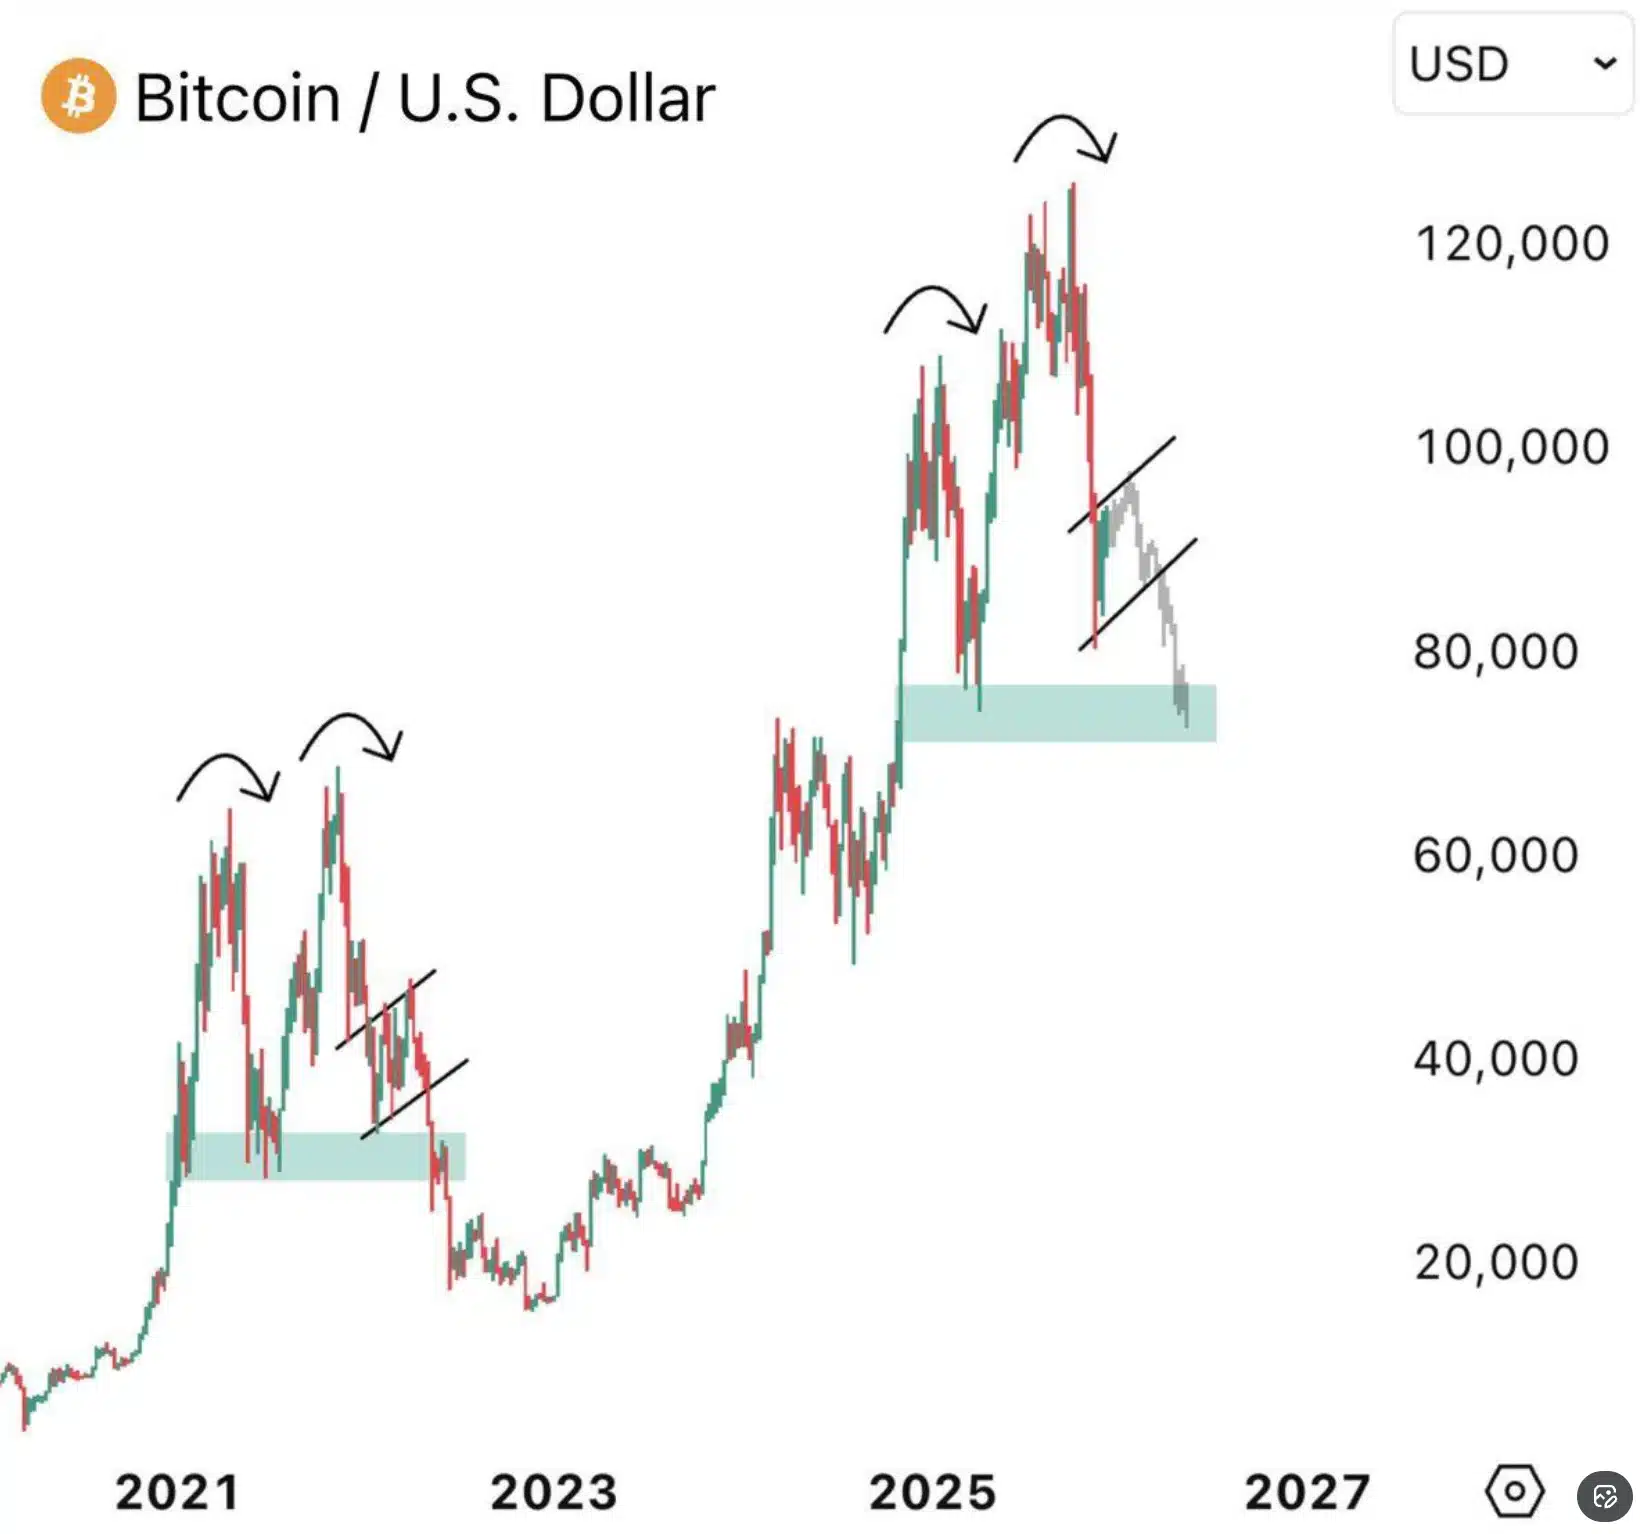
(Source: Trading View)
Beneath the surface of prevailing pessimism, some analysts see a different picture. Bitcoin has entered the so-called “Mini Bat” pattern— after retracing nearly all recent gains, it stabilizes within a lower range. This slow, calm consolidation after losing key support levels may seem boring to most traders, but historically, such calmness often precedes major moves.
The super cycle theory suggests that, driven by structural demand from ETFs, delayed halving effects, and global liquidity expansion, Bitcoin could enter a longer, more sustained upward phase than traditional four-year cycles. If Bitcoin surpasses its all-time high in 2026, it could trigger a prolonged rally, a genuine altcoin boom, and major activity driven by mainstream crypto applications.
AMBCrypto analysis indicates Bitcoin remains supported between its 50-week and 100-week moving averages, near $84,000 to $85,000. Analyst Behnam Abebi believes that below $80,000 is a strong buy zone. If these technical support levels hold, Q1 2026 could mark the start of a new bull market. The key factors are whether ETF capital inflows can accelerate again and whether the Fed resumes rate cuts in 2026.
Institutional Double-Edged Sword: Stable but Losing Explosive Power
CryptoQuant data shows that in 2024, True MVRV only reached 2.17, far below the 3 to 4 times levels of previous cycles. True MVRV measures overall market profitability; low readings indicate a more mature market, with savvy investors taking profits early and reducing volatility. This is a direct result of institutionalization: professional investors avoid chasing extreme highs and instead sell in stages at reasonable valuations.
ETFs help support prices but also reduce expectations of explosive rallies. The creation and redemption mechanism of spot ETFs causes arbitrage when prices deviate from net asset value, which helps contain downside risk but also limits upside potential. Public interest is waning, and increased institutional control raises doubts about whether Bitcoin is drifting away from its original decentralized nature.
As 2026 approaches, investors must face a new reality: Bitcoin may become safer and more predictable, but this stability comes at the cost of losing its once-wild energy. For speculators seeking 10x returns, this is a disappointing shift. But for long-term value storage and inflation hedging institutions, these are the qualities they desire. Bitcoin in 2026 may not repeat the madness of 2017 or 2021, but it could achieve healthier, more sustainable growth.
Disclaimer: The information on this page may come from third parties and does not represent the views or opinions of Gate. The content displayed on this page is for reference only and does not constitute any financial, investment, or legal advice. Gate does not guarantee the accuracy or completeness of the information and shall not be liable for any losses arising from the use of this information. Virtual asset investments carry high risks and are subject to significant price volatility. You may lose all of your invested principal. Please fully understand the relevant risks and make prudent decisions based on your own financial situation and risk tolerance. For details, please refer to
Disclaimer.
Related Articles
BTC drops 0.62% over 15 minutes: exchange net inflows intensify and short-term arbitrage converges to trigger volatility
From 18:00 to 18:15 on April 9, 2026 (UTC), the BTC price return recorded -0.62%, closing in the range of 71857.8 to 72375.1 USDT, with a trading range of 0.72%. Market attention was notably elevated, volatility intensified, and capital moved quickly within a short period. Overall market sentiment has become more cautious, and investors’ willingness to trade in the short term has increased.
The main driving force behind this abnormal move is an increase in net inflows to BTC exchanges during the anomaly window; the 10-minute net flow reached 755.92 BTC, indicating that some investors chose to transfer funds to exchanges to seek arbitrage opportunities in the midst of the volatility issue
GateNews49m ago
BTC 15-minute pump 0.55%: Large on-chain funds inflows and options positioning resonate to lift spot prices
2026-04-09 17:00 to 2026-04-09 17:15 (UTC), the BTC spot market saw a rapid spike with a +0.55% return. The price range was 72,063.9 to 72,518.5 USDT, and the full-period amplitude reached 0.63%. This upswing coincided with rising market attention; volatility clearly intensified, drawing funds into short-term trading in a mix of cautious sentiment and localized increased volume.
The main driving force behind this move was concentrated inflows to exchanges from on-chain large transfers, which pushed up spot market buy orders in a short time. Data shows that, in the past 24 hours, on-chain BTC transfers
GateNews1h ago
Mainstream CEX and DEX funding-rate displays suggest an increasingly bearish market sentiment
On April 10, the Bitcoin price broke through $72k again. According to Coinglass data, the funding rates on major trading platforms show that the market’s bearish sentiment is strengthening. Funding rates are used to balance the contract price with the asset price; a rate below 0.005% indicates that the market is broadly bearish.
GateNews2h ago
Over the past 1 hour, forced liquidations across the entire market totaled $101 million, including $80.39 million in BTC liquidations.
Gate News message, on April 9, CoinGlass data shows that over the past 1 hour, liquidations across the entire network totaled $101 million, including $97.07 million from short liquidations and $3.54 million from long liquidations. In addition, the liquidation amount for BTC reached $80.39 million, while the liquidation amount for ETH reached $11.79 million.
GateNews3h ago
CME Group BTC futures liquidity falls to a 14-month low, with basis trading failures triggering institutional capital outflows
The Chicago Mercantile Exchange’s Bitcoin futures market has continued to weaken. In March 2026, the daily average open interest fell to $7.2 billion, hitting a new low since February 2024, and has been declining for five straight months. The main reason is the large-scale unwinding of basis trades, which eliminated the arbitrage spread and caused leveraged capital to exit.
GateNews3h ago
