Ethereum (ETH) has remained above the support level since its decline from the peak in late July, with market participants closely following the key price range and technical signals to predict the next move. Today (4), during the Asian session, the trading price of Ethereum is $3,568, temporarily shaking off the sluggish weekend market.
The market cap of Ethereum is $421.93 billion, down 0.36%. The 24-hour trading volume decreased by 22.66% to $28.18 billion, with a decrease in trading intensity. The ratio of trading volume to market cap is 6.93%.
Ethereum Price Prediction
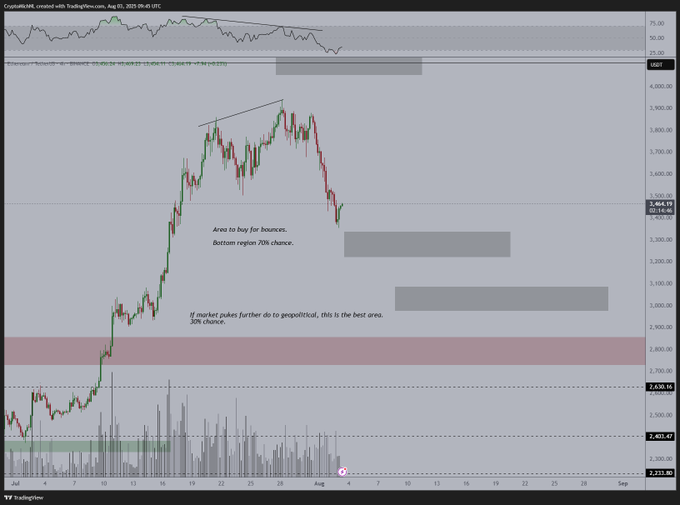
(Source: Trading View)
Market analyst Michaël van de Poppe stated that a 15% drop from recent highs could create a positive environment for accumulation, and a reversal may occur if these lower levels are reached.
He predicts that if the momentum changes, the next upward target could break through $4,000.
The technical chart shared by CryptoInsMR indicates two areas that are very likely to be bullish again. Based on previous volume support and past consolidation trends, there is a 70% chance of a price rebound in the range between $3,200 and $3,400.
The second support area is between $2,950 and $3,100, with a 30% possibility of reaching that area if broader market risks persist, which is a deeper entry point.
Ethereum Recent Trading Dynamics and Market Indicators
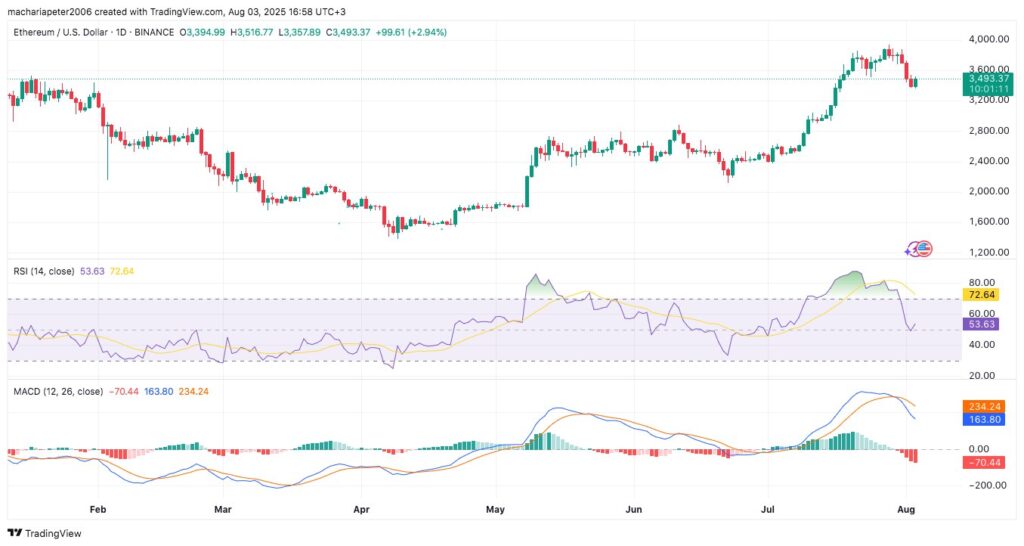
(Source: Trading View)
The price trend of Ethereum experienced a sudden rise from early July to August, followed by a retreat from a high point near $3,950. During this pullback, the Relative Strength Index (RSI) showed a bearish trend, with the price rising at one point, but the RSI reading declining.
Since then, the RSI has remained at 53.63, having rebounded from a previous low after falling below the overbought zone of 72.64.
The MACD indicator also shows a low sentiment. On the previous trading day, the MACD line remained at 163.80, below the signal line (234.24), with a histogram reading of -70.44.
Disclaimer: The information on this page may come from third parties and does not represent the views or opinions of Gate. The content displayed on this page is for reference only and does not constitute any financial, investment, or legal advice. Gate does not guarantee the accuracy or completeness of the information and shall not be liable for any losses arising from the use of this information. Virtual asset investments carry high risks and are subject to significant price volatility. You may lose all of your invested principal. Please fully understand the relevant risks and make prudent decisions based on your own financial situation and risk tolerance. For details, please refer to
Disclaimer.
