Although PEPE is showing positive signals with a bullish pattern suggesting the potential for further upward movement, many other market indicators are providing conflicting signals, making the growth outlook less certain.
Bitcoin Magazine has conducted an in-depth analysis of the factors that may hinder the potential recovery of PEPE, while also assessing the drivers that could support the bullish trend in the near future.
PEPE forms a bullish triangle pattern
On the 4-hour timeframe, PEPE is moving within a bullish triangle pattern – a technical structure that often signals a potential breakout, with a horizontal resistance line above and an upward-sloping support line below converging.
In most cases, this pattern usually leads to a breakout in a bullish direction, when the price breaks through the resistance zone. However, the recent price chart reveals a different story.
Specifically, each time PEPE approaches the resistance level, the price prints long wicks instead of solid candles - a signal indicating that strong selling pressure is present in this area. This raises concerns about the possibility of a short-term bearish adjustment.
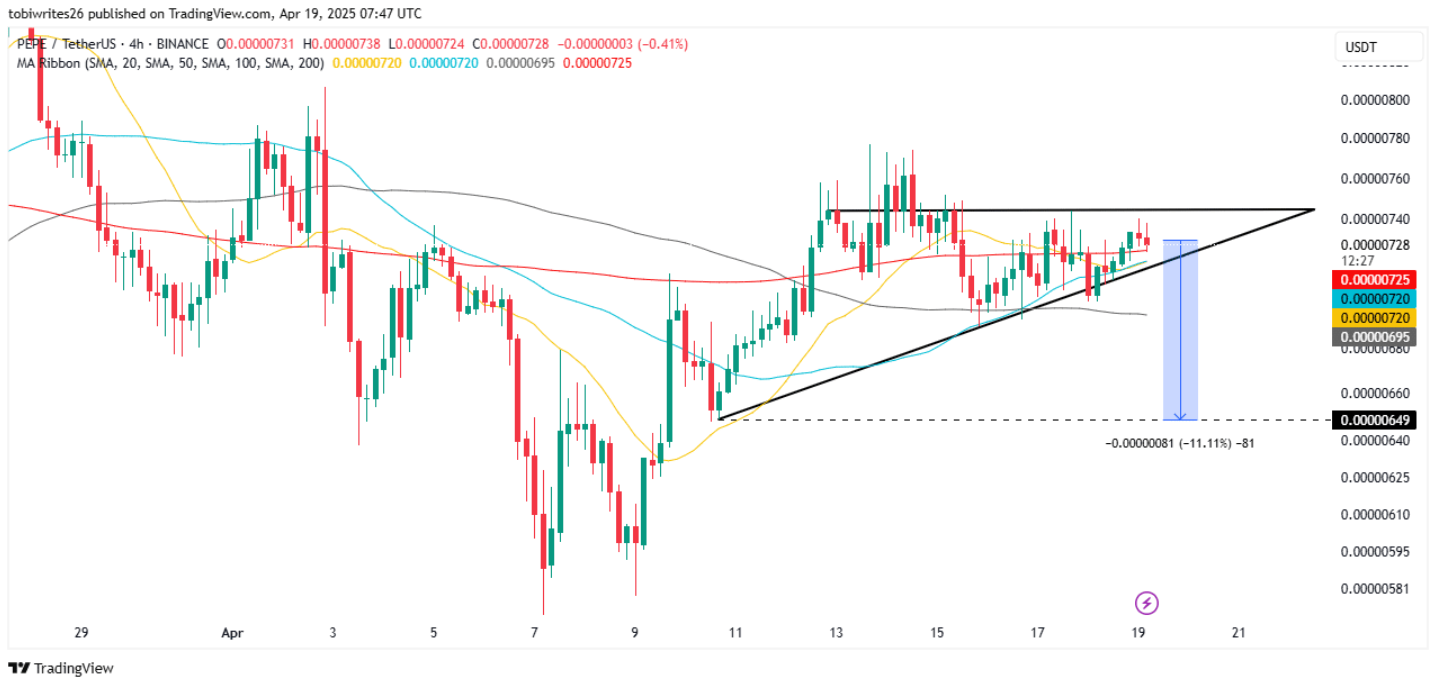 Source: TradingViewNot stopping there, other technical signals are also reinforcing the negative scenario. Notably, the appearance of the “death cross” pattern, when the (SMA) 20-period moving average crosses below the (SMA) 200-period moving average - a signal often associated with a bearish trend.
At the time of writing, the 20-period SMA has officially fallen below the 200-period SMA, pulling the price of PEPE back close to the support line of the triangle pattern.
In addition, the Accumulation/Distribution indicator (A/D) also shows clear signs of a distribution phase – when money is leaving the market, reflecting investors’ profit-taking or capital withdrawal mentality, thus creating downward pressure on prices.
 Source: TradingView## Weak momentum as trading volume declines despite price bullish
In addition, the change in trading volume also clearly reflects signs of weakening momentum.
Although PEPE has recorded a bullish increase of 1.49% in the past 24 hours, the trading volume has sharply decreased by 36.4%. This divergence between price and volume often indicates a recovery that lacks strength and sustainable momentum.
Moreover, derivatives traders may also be contributing to pushing the price of PEPE down.
Funding Rate – an indicator showing which side has the upper hand in the market – has now turned negative, at -0.0097. This indicates that the bears (Short) are in control and are willing to pay periodic fees to maintain their position.
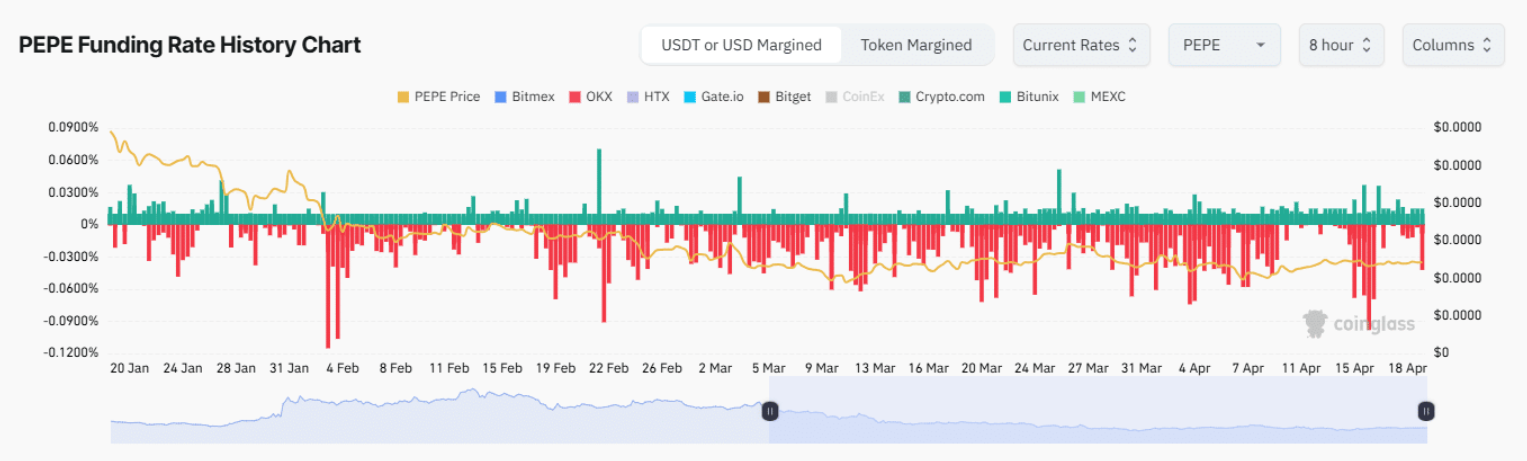 Source: CoinGlass## Spot traders are accumulating
Disclaimer: The information on this page may come from third parties and does not represent the views or opinions of Gate. The content displayed on this page is for reference only and does not constitute any financial, investment, or legal advice. Gate does not guarantee the accuracy or completeness of the information and shall not be liable for any losses arising from the use of this information. Virtual asset investments carry high risks and are subject to significant price volatility. You may lose all of your invested principal. Please fully understand the relevant risks and make prudent decisions based on your own financial situation and risk tolerance. For details, please refer to
Disclaimer.
