
Key Takeaways
-
SUI has dropped nearly 67% from its recent peak, placing it in a potential bottoming zone.
-
Current price action closely mirrors Solana’s 2025 bottoming fractal, which preceded a strong reversal.
-
A reclaim of the 50-day moving average could confirm a trend shift and open the door for a broader recovery.
SUI, the native token of Sui’s Layer-1 blockchain, has struggled to live up to its early hype in recent months, especially when compared to** Solana’s (SOL)** 2021 explosive performance. A broader market correction has only added pressure, dragging SUI nearly 50% lower over the past 90 days.
But zooming out and looking beneath the surface, the current price structure tells a more interesting story. On the charts, SUI is starting to resemble a bottoming fractal previously seen in Solana—a setup that eventually led to a sharp and sustained upside move.
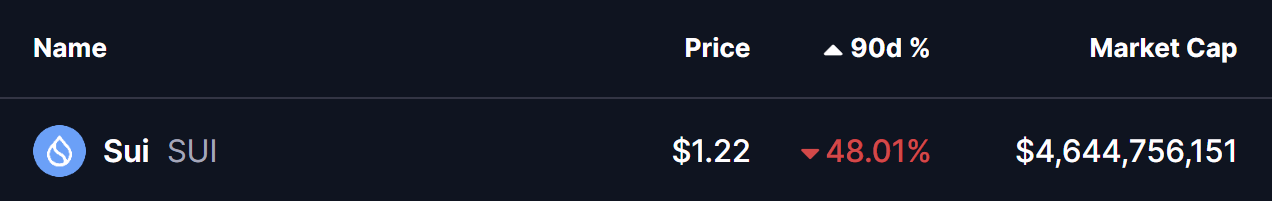
Source: Coinmarketcap
SUI Mirrors SOL’s Bottoming Path
A side-by-side comparison of SUI and SOL reveals striking similarities.
Back in early 2025, **Solana **topped near $295 before entering a sharp corrective phase. Price slipped below the 50-day moving average, signaling weakening momentum. The sell-off eventually stretched into a deep 67% drawdown, flushing out late longs and marking a clear sentiment reset.
That low proved pivotal.
Once SOL reclaimed its 50-day moving average, the trend structure flipped. What followed was a 163% rally, one of the most notable reversals of 2025.
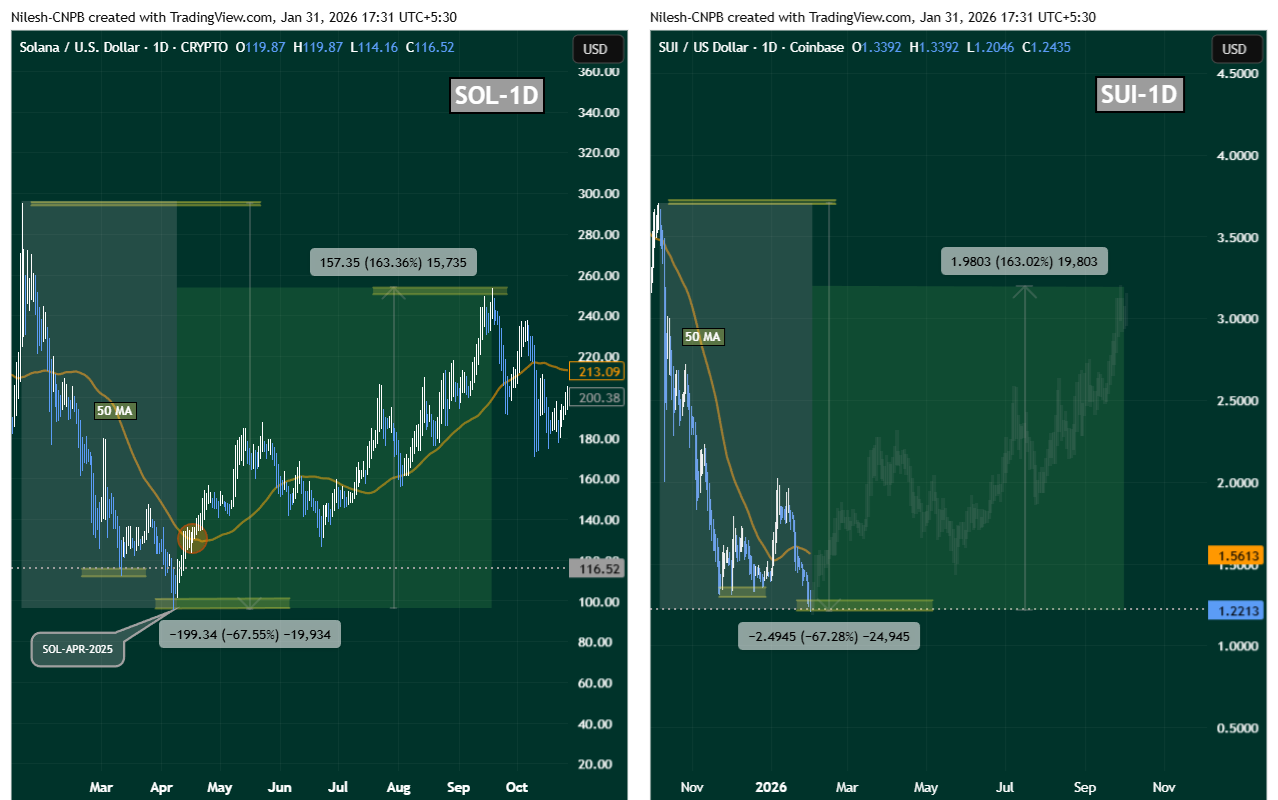
SOL and SUI Fractal Chart/Coinsprobe (Source: Tradingview)
SUI now appears to be following a similar script.
After peaking around $3.70 in October 2025, SUI entered a steep correction, losing its 50-day moving average and sliding into a nearly identical 67% drawdown. Momentum faded, volatility compressed, and price action began to flatten—classic characteristics of a market searching for a base.
What’s Next for SUI?
From a technical perspective, SUI is now sitting near a critical inflection zone around $1.20–$1.22, an area that could act as a potential bottom if buyers continue to defend it.
The first major confirmation bulls will want to see is a reclaim of the 50-day moving average, currently hovering near $1.56. A sustained move above this level would signal that bearish momentum is fading and that buyers are regaining control.
If that reclaim occurs, SUI could transition into a broader recovery phase. In a scenario where the SOL fractal continues to play out, upside expansion toward the $3.00–$3.20 region would come back into focus over the medium term.
Key Risk Note
While fractal comparisons can offer valuable context, they are not guarantees. Each asset trades within its own liquidity environment, sentiment cycle, and macro backdrop. For SUI, confirmation still matters—especially through moving average reclaims and consistent follow-through buying.
Until then, the structure suggests risk is compressing, not expanding.
Disclaimer: The views and analysis presented in this article are for informational purposes only and reflect the author’s perspective, not financial advice. Technical patterns and indicators discussed are subject to market volatility and may or may not yield the anticipated results. Investors are advised to exercise caution, conduct independent research, and make decisions aligned with their individual risk tolerance.
About Author: Nilesh Hembade is the Founder and Lead Author of Coinsprobe, with over 5 years of experience in the cryptocurrency and blockchain industry. Since launching Coinsprobe in 2023, he has been providing daily, research-driven insights through in-depth market analysis, on-chain data, and technical research.
Disclaimer: The information on this page may come from third parties and does not represent the views or opinions of Gate. The content displayed on this page is for reference only and does not constitute any financial, investment, or legal advice. Gate does not guarantee the accuracy or completeness of the information and shall not be liable for any losses arising from the use of this information. Virtual asset investments carry high risks and are subject to significant price volatility. You may lose all of your invested principal. Please fully understand the relevant risks and make prudent decisions based on your own financial situation and risk tolerance. For details, please refer to
Disclaimer.
Articoli correlati
The Definitive Stablecoin Landscape Series: North America
What to know:
Stablecoins are into their third phase of evolution - the institutionalization era - transitioning from crypto-native tools into core financial infrastrucutre. What began as a mechanism for trading and liquidity has evolved into a foundational layer for payments, cross-border
CoinDesk6m fa
Cardano Holds Key Support as Whale Activity Signals Shift
Key Insights:
Whale accumulation increased steadily since March, with large holders absorbing supply near lows while retail activity remained subdued during weak price action phases.
Stablecoin liquidity on Cardano doubled year over year, strengthening market depth and supporting stronger
CryptoNewsLand44m fa
Solana Holds Key Support as Bitcoin Rally Lifts Crypto Market
Solana's price remained above $80 amid rising Bitcoin values, contributing to a broader crypto market recovery with a capitalization of $2.35 trillion. Institutional demand and easing geopolitical tensions supported this growth, while Solana led in decentralized finance activity, recording significant DEX and stablecoin volumes in March.
CryptoNewsLand1h fa
Hyperliquid Sees Sharp Volume Drop as Netflows Turn Deeply Negative
Hyperliquid’s derivatives volume dropped sharply, with some platforms reporting declines above 60%, signaling reduced speculative activity and weakening trader engagement across markets.
Netflows turned deeply negative near -285%, reflecting sustained capital withdrawal as both spot and
CryptoNewsLand1h fa
BTC 15分钟拉升0.84%:流动性不足与期货溢价套利共振推动上行
2026-04-05 15:15至15:30(UTC),BTC价格在66938.9至67529.9 USDT区间内波动,15分钟收益率达到+0.84%,振幅为0.88%。同期市场交易活跃度上升,链上10分钟活跃地址数达到420,690,短线买盘情绪提升,带动市场关注。
本次异动的主要驱动力来自现货与衍生品市场持续流动性紧张,当前交易量显著低于2023年底以来区间,买盘推动价格上行门槛显著降低。
GateNews2h fa
Hyperliquid Price Gains as Futures Activity Lifts Momentum
Key insights
Hyperliquid open interest climbed above one point six billion dollars, signaling stronger derivatives participation and reinforcing current price momentum across markets.
Commodity perpetuals and event contracts increased trading activity, pushing daily volumes past two point fo
CryptoNewsLand3h fa
