
Key Highlights
-
ASTER trades in the green as on-chain activity remains strong among perpetual DEXs.
-
Aster ranks 2nd in 30-day perpetual volume at $135.85B, just behind Hyperliquid, per DefiLlama data.
-
Bullish fractal setup emerges, mirroring DASH’s recent breakout structure on the 4H chart.
-
ASTER is holding wedge support near $0.68, a critical level for maintaining the bullish structure.
-
A decisive reclaim of the 200-period MA at $0.7501 could trigger upside continuation.
Aster (ASTER), the native token of the Aster perpetual DEX, is trading in the green over the past 24 hours, showing early signs of strength as broader market conditions stabilize. While price action remains relatively muted for now, a deeper look at both on-chain data and technical structure suggests that ASTER may be positioning for a upside move.
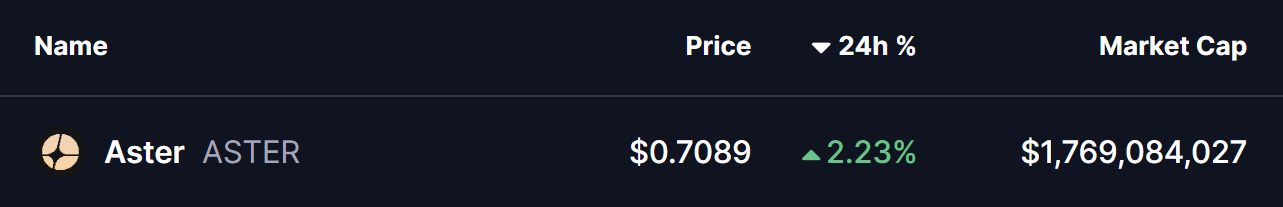
Source: Coinmarketcap
Notably, ASTER’s current price behavior is beginning to resemble a bullish fractal pattern that recently played out on Dash (DASH) — a setup that ultimately led to a sharp breakout rally. If this structure continues to develop, ASTER could be preparing for a similar upside expansion.
ASTER Leads in On-Chain Perpetual Metrics
Aster continues to stand out among decentralized perpetual exchanges. According to live data from DeFiLlama, Aster recorded approximately $135.85 billion in 30-day perpetual trading volume, ranking second across the sector. Hyperliquid currently holds the top position with $147.18 billion, while Lighter trails in third place.
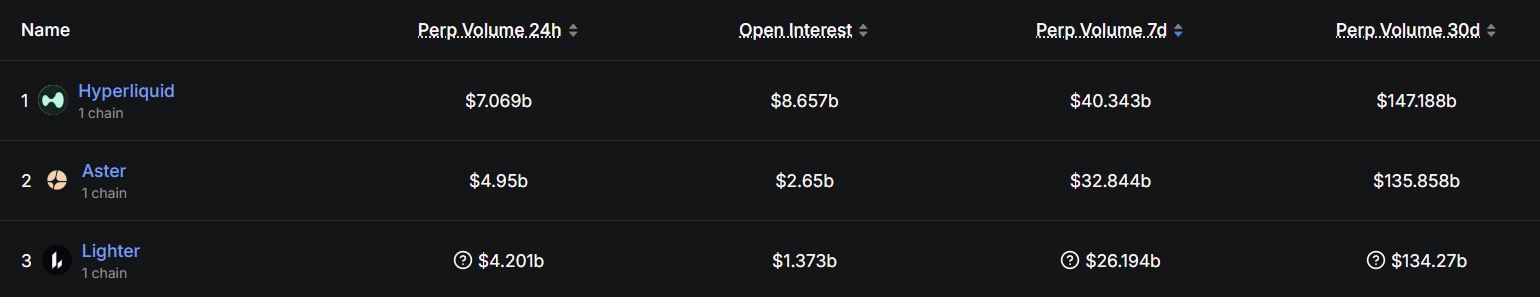
PERP Trading Volume/Source: Defillama
This sustained trading activity highlights strong user engagement and liquidity on the platform — an important foundation that often precedes meaningful price movements in native tokens.
ASTER Mirrors DASH’s Breakout Structure
From a technical perspective, ASTER’s chart structure is drawing increasing attention. On the 4-hour timeframe, DASH recently completed a bullish breakout after forming an ascending broadening wedge — a reversal pattern commonly seen during trend transitions.
DASH first bounced from wedge support, reclaimed its 200-period moving average, and then broke above the upper boundary of the structure. This sequence triggered a powerful rally of nearly 87% from local lows.
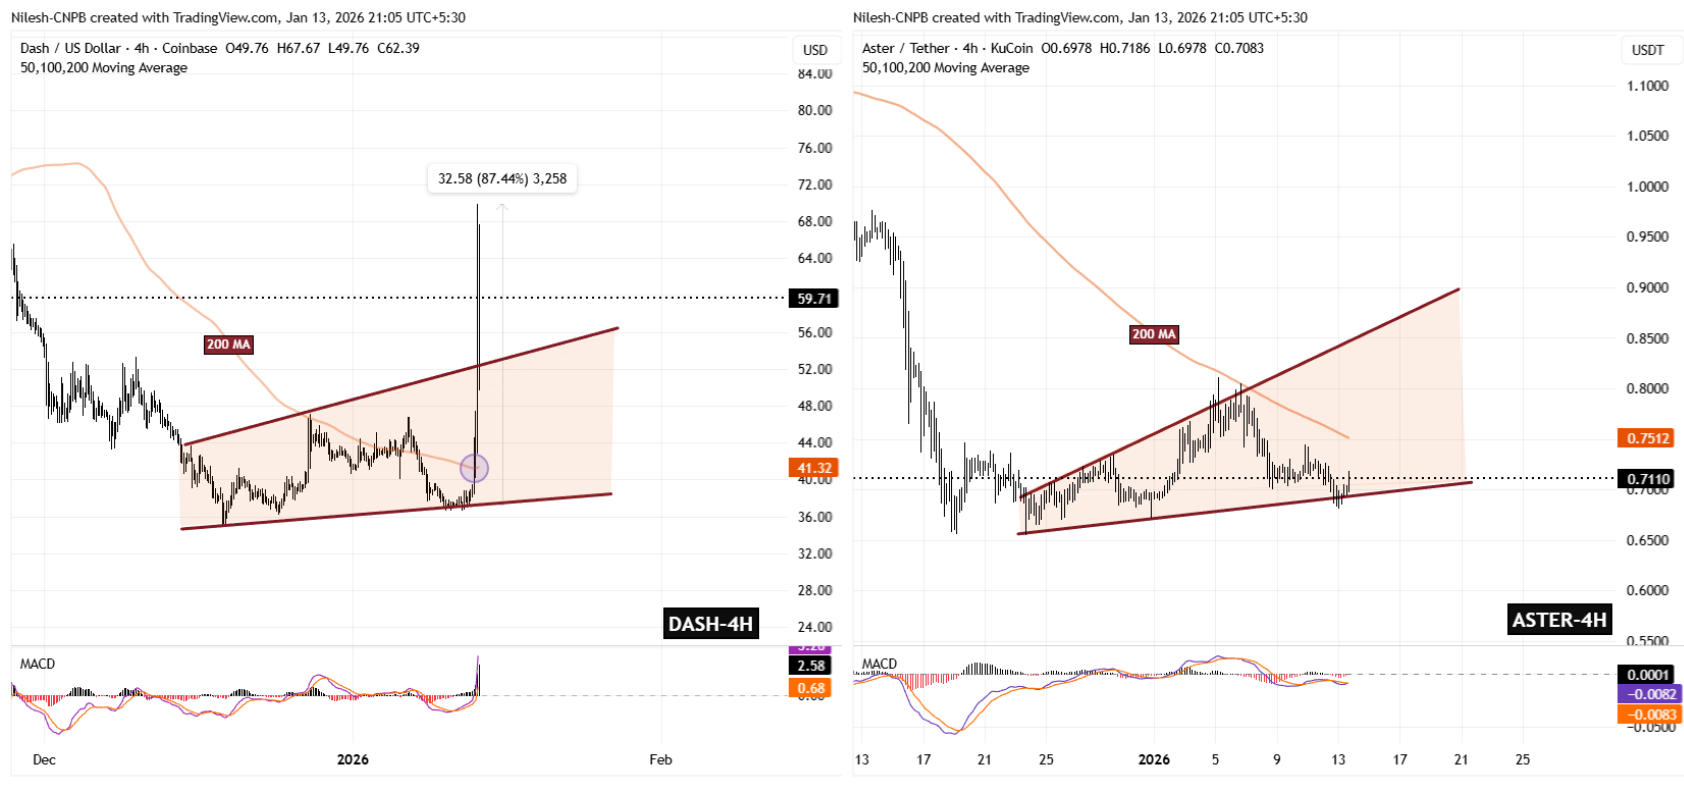
DASH and ASTER Fractal Chart/Coinsprobe (Source: Tradingview)
ASTER now appears to be following a similar roadmap.
Key Levels on the ASTER Chart
On the 4H chart, ASTER is currently respecting a rising wedge support around $0.68, keeping the broader bullish structure intact. However, the token remains capped by a major technical hurdle — the 200-period moving average near $0.7501, which has acted as dynamic resistance.
This compression between rising support and overhead resistance suggests that a decisive move may be approaching.
What’s Next for ASTER?
For bullish confirmation, ASTER needs a clean reclaim of the 200 MA at $0.7501. A sustained move above this level could allow price to test the upper boundary of the wedge and potentially trigger an acceleration phase — similar to what was observed in DASH’s breakout.
On the downside, failure to hold the $0.68 wedge support would weaken the fractal comparison and could invalidate the bullish setup, pushing ASTER back into consolidation.
For now, ASTER sits at a technically sensitive zone. With strong on-chain dominance and a familiar breakout structure forming, the coming sessions may prove critical in determining whether this setup evolves into a sustained upside move.
Bottom Line
ASTER is approaching a technically important inflection point. With strong on-chain dominance in perpetual volume and a chart structure closely resembling DASH’s recent breakout, the setup favors a potential upside move — provided price holds wedge support and reclaims the 200 MA. While the fractal comparison strengthens the bullish case, failure to maintain the $0.68 support would invalidate the setup and delay any breakout scenario.
Frequently Asked Questions (FAQ)
What is Aster (ASTER)?
Aster is a decentralized perpetual futures exchange (Perp DEX), and ASTER is its native utility token used within the platform’s ecosystem.
Why is ASTER price rising today?
ASTER is trading higher due to strong on-chain activity, leading perpetual trading volume, and a bullish technical structure forming on the 4-hour chart.
What bullish pattern is forming on ASTER’s chart?
ASTER appears to be forming a bullish fractal setup similar to DASH’s recent breakout from an ascending broadening wedge pattern.
What is the key support level for ASTER?
The critical support level lies near **$0.**68, which aligns with the lower boundary of the wedge structure.
What resistance must ASTER break for upside confirmation?
ASTER needs to reclaim the 200-period moving average around $0.7501 to confirm bullish continuation.
Can ASTER repeat DASH’s breakout rally?
While no outcome is guaranteed, ASTER’s structure closely resembles DASH’s pre-breakout phase. Holding support and reclaiming resistance could increase the probability of a similar move.
Disclaimer: The information on this page may come from third parties and does not represent the views or opinions of Gate. The content displayed on this page is for reference only and does not constitute any financial, investment, or legal advice. Gate does not guarantee the accuracy or completeness of the information and shall not be liable for any losses arising from the use of this information. Virtual asset investments carry high risks and are subject to significant price volatility. You may lose all of your invested principal. Please fully understand the relevant risks and make prudent decisions based on your own financial situation and risk tolerance. For details, please refer to
Disclaimer.
Articoli correlati
'Bitcoin ETF Performance Pales Next to Gold': Mike McGlone - U.Today
Mike McGlone, a Bloomberg strategist, argues that Bitcoin ETFs may not drive long-term growth for Bitcoin, which has underperformed compared to gold. Despite recent gains, Bitcoin's performance seems capped, suggesting a potential peak in crypto enthusiasm.
UToday10m fa
XRP Eyes $1.60 as April History Shapes Market Expectations
Key Insights:
XRP historical April data shows sharp gains and losses, with 2021 marking a 180% surge while recent years reflect declining monthly performance trends.
Current price consolidation between $1.28 and $1.36 suggests reduced volatility, signaling a potential breakout as traders mon
CryptoNewsLand11m fa
Cardano Price Holds Gains as Bullish Signals Strengthen
Key Insights
Cardano trades above $0.25 as steady recovery continues, supported by improving sentiment and growing engagement across crypto discussions among market participants globally.
Derivatives data show rising long positions and positive funding rates, indicating traders
CryptoNewsLand14m fa
XRP Struggles Below $1.35 as Bearish Signals Build
XRP is under significant selling pressure after repeated rejections at resistance around $1.35. Weak momentum indicators and rising short interest suggest increased downside risk, with critical support at $1.30-$1.28. A break below this level could lead to further declines.
CryptoNewsLand18m fa
Pepe Price Holds Steady as ETF Filing Lifts Market Attention
Canary Capital’s ETF filing enhances Pepe Coin's institutional appeal, although trader participation declines, impacting derivatives activity. Price movements hinge on key levels of support and resistance as the market faces mixed sentiment.
CryptoNewsLand22m fa
Ethereum Breaks Upward as Bullish Momentum Returns — What Next for ETH?
ETH rises above $2,200 as buyers regain control and defend key support.
Derivatives and ETF inflows show growing demand and renewed market confidence.
Critical support near $2,000 will determine if bullish momentum can continue.
Ethereum has finally shown signs
CryptoNewsLand1h fa
