
**Date: **Wed, Jan 07, 2026 | 06:20 AM GMT
The broader cryptocurrency market continues to show strong New Year momentum, with Bitcoin (BTC) up around 4% and Ethereum (ETH) gaining over 9% on a weekly basis. This improving sentiment is gradually spilling over into major altcoins — including the DePIN-focused token Akash Network (AKT).
AKT has already posted an impressive 20% weekly gain. While this short-term strength has caught traders’ attention, the more important development is unfolding on the higher-timeframe chart. Recent price action suggests a meaningful shift in market structure, hinting that AKT may be transitioning out of a prolonged corrective phase and into the early stages of a bullish continuation.
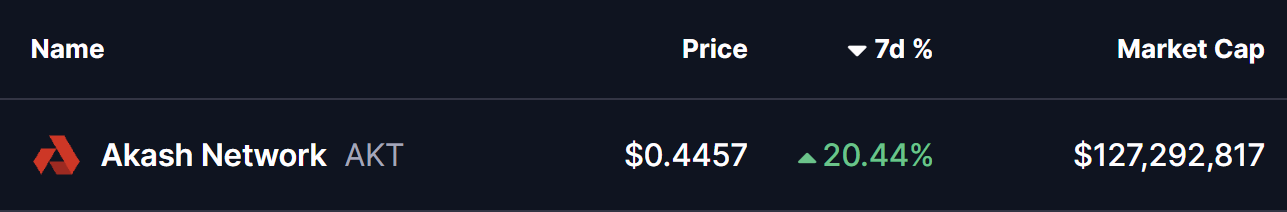
Source: Coinmarketcap
Falling Wedge and Rounding Bottom in Play
On the daily chart, AKT has been trading within a broader falling wedge — a structure that often precedes bullish reversals as selling pressure gradually weakens. Within this larger wedge, price action is also shaping a developing rounding bottom pattern, reflecting steady accumulation and seller exhaustion.
The formation began after AKT faced strong rejection near the $0.5441 resistance zone in late November. That rejection triggered a sharp sell-off, pushing price lower toward the $0.3465 region. However, bears failed to extend losses beyond this area. Instead, demand stepped in, downside momentum slowed, and price began to stabilize.
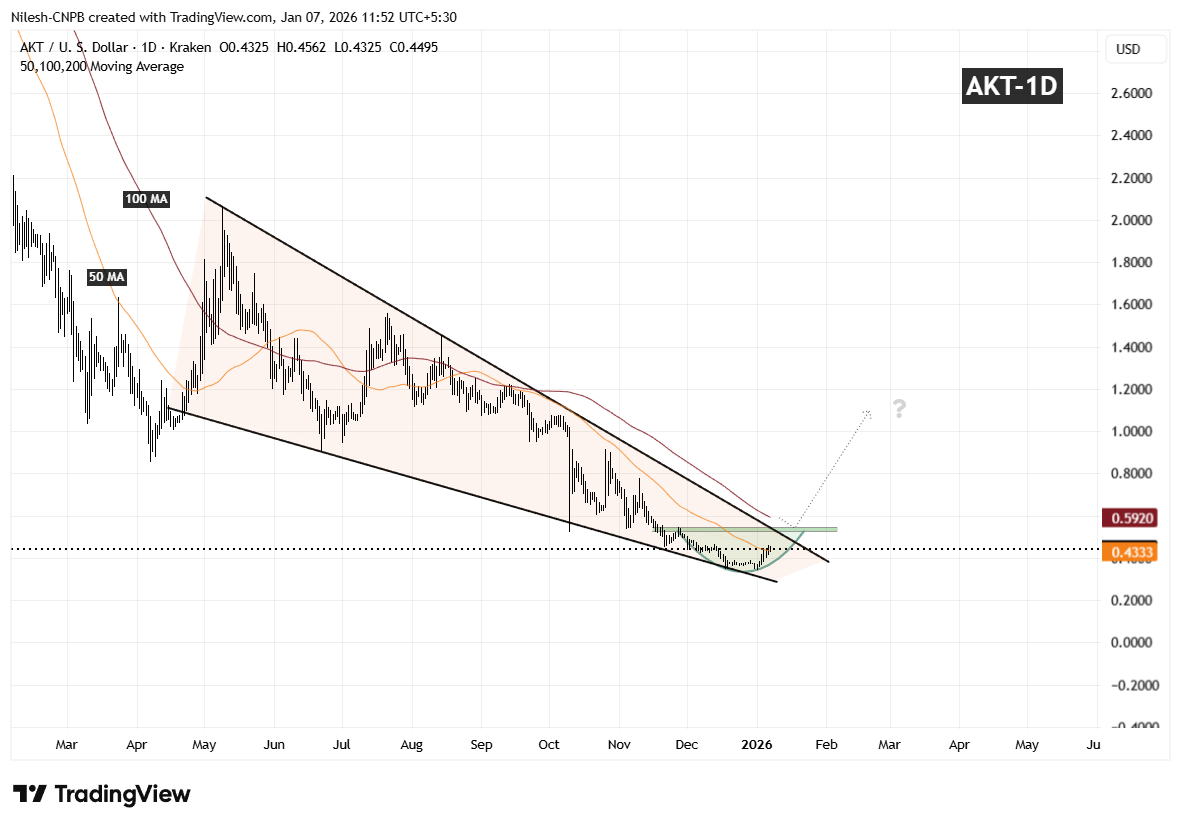
Akash Network (AKT) Daily Chart/Coinsprobe (Source: Tradingview)
Over the following weeks, volatility compressed and AKT started to curl higher in a smooth, rounded fashion — closely matching the textbook behavior of a rounding bottom. Importantly, the recent rebound has pushed price back above the 50-day moving average around $0.4333, a level that had previously acted as resistance and is now beginning to flip into support.
What’s Next for AKT?
If AKT can continue to hold above the 50-day moving average, this area may act as a solid base for further upside attempts. From here, attention shifts toward the descending resistance trendline of the falling wedge, which aligns closely with the $0.5441 resistance zone.
A clean and decisive breakout above this confluence area, followed by sustained acceptance, would confirm a broader bullish expansion phase and mark a clear trend reversal from the prior downtrend. Such a move would likely attract renewed momentum participation as the market recognizes the structural shift.
Until that breakout occurs, the pattern remains in development. Short-term consolidation or shallow pullbacks are still possible as price digests recent gains. However, as long as AKT continues to print higher lows above the established base, the broader technical structure remains constructive.
Overall, the chart suggests AKT is approaching a critical inflection point — one that could determine whether this recovery evolves into a sustained bullish trend as 2026 progresses.
Disclaimer: The views and analysis presented in this article are for informational purposes only and reflect the author’s perspective, not financial advice. Technical patterns and indicators discussed are subject to market volatility and may or may not yield the anticipated results. Investors are advised to exercise caution, conduct independent research, and make decisions aligned with their individual risk tolerance.
About Author: Nilesh Hembade is the Founder and Lead Author of Coinsprobe, with over 5 years of experience in the cryptocurrency and blockchain industry. Since launching Coinsprobe in 2023, he has been providing daily, research-driven insights through in-depth market analysis, on-chain data, and technical research.
Disclaimer: The information on this page may come from third parties and does not represent the views or opinions of Gate. The content displayed on this page is for reference only and does not constitute any financial, investment, or legal advice. Gate does not guarantee the accuracy or completeness of the information and shall not be liable for any losses arising from the use of this information. Virtual asset investments carry high risks and are subject to significant price volatility. You may lose all of your invested principal. Please fully understand the relevant risks and make prudent decisions based on your own financial situation and risk tolerance. For details, please refer to
Disclaimer.
Articoli correlati
XRP Breaks Above $1.40 as Spot ETF Inflows Hit $17.6M Milestone
XRP breaks $1.40 after Ripple partnership boosts investor confidence and market momentum.
Spot XRP ETFs record $17.6M inflows, signaling rising institutional demand and interest.
Technical indicators show resistance ahead, with support holding near $1.40 and $1.3840.
Ripple’s XRP is
CryptoNewsLand3h fa
PEPE Reclaims 0.00000400 — Is This 1.8% Move the Start of a Bigger Run?
PEPE rebounds from 0.00000385 support, forming higher lows and stronger bullish structure.
Technical indicators like MACD and RSI show momentum with room for further upside.
Key resistance at 0.00000410; support at 0.00000380 critical for trend continuation.
PepeCoin — PEPE, has
CryptoNewsLand7h fa
ETH 15分钟下跌0.58%:衍生品流动性收缩与主动减仓主导短线回调
2026-04-19 04:30 至 2026-04-19 04:45(UTC),ETH在15分钟K线内收益率录得-0.58%,价格区间处于2321.62至2342.04 USDT,振幅达到0.87%。短线跌势发生在市场整体波动加剧、主流加密资产价格普遍下行背景下,市场风险偏好明显下降,交易者观望情绪增强。
本次异动的主要驱动力是衍生品市场流动性的大幅收缩及杠杆资金主动减仓。数据显示,24小时
GateNews8h fa
Spark Protocol's January delisting of rsETH proves prudent as Aave faces ETH liquidity crisis
Spark Protocol's strategy of delisting low-usage assets and tightening collateral has faced initial backlash but proved wise during market turmoil. While maintaining higher interest rate caps, SparkLend ensures liquidity, unlike Aave, which now faces significant risks.
GateNews9h fa
Request Network (REQ) Surges 23.68% in 15 Minutes, 24-Hour Gain Reaches 116.52%
Request Network (REQ) surged 23.68% in just 15 minutes, reaching $0.152, with a 24-hour rise of 116.52% and trading volume over $8 million. Factors include retail interest and whale accumulation. Resistance at $0.160 and support at $0.122 are under observation.
GateNews10h fa
Solana Price Stalls Near $80 as ETF Outflows Weigh
Solana trades around $80, facing bearish sentiment due to ETF outflows and declining retail participation. Technical indicators show mixed signals, with resistance at $87 and $98, while support at $77 remains critical for stability.
CryptoFrontNews14h fa
