
Cardano is kicking off 2026 with some renewed energy, and the chart is making one thing very clear. ADA is right back at the level that’s been holding it down for weeks.
As Sssebi put it, ADA “wants to fly” as it presses into the $0.40 zone, and that’s not hype, it’s just what the ADA chart is showing.
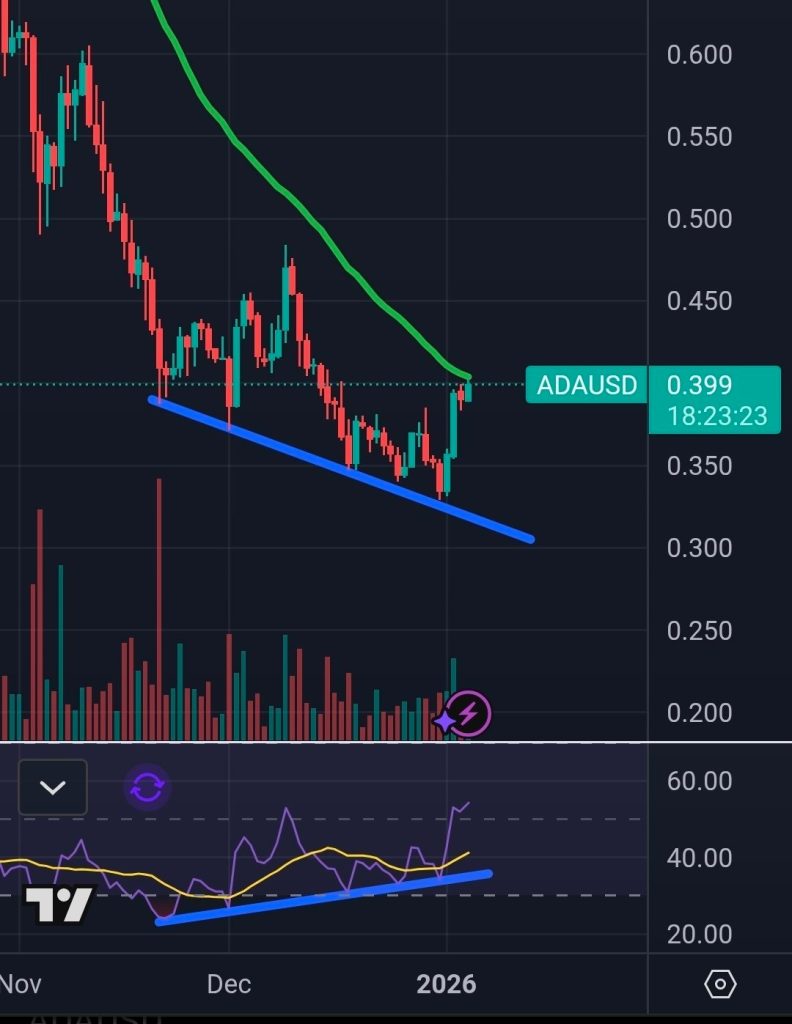
The ADA price is hovering around the area of $0.399 following the remarkable recovery. Now, it seems like the market is reaching a crossroads in terms of what might happen next.
- What the ADA Chart Is Really Saying
- RSI Is Helping the Bullish Case, But Proof Still Matters
- What’s Next for ADA?
What the ADA Chart Is Really Saying
The first thing that stands out is the pressure from above. That downward-sloping green line has acted as a lid on price, stopping multiple rally attempts. Right now, ADA is testing that trendline at the same time it’s testing horizontal resistance near $0.40, which makes this area especially important.
Source: X/@Sssebi
Below the price, the blue trendline tells another part of the story. The ADA price kept making lower lows during the pullback, but that support line held firm. When the price bounced, it did so quickly, which usually signals that sellers were running out of steam near the lows.
This is the kind of setup where the market compresses, finds a floor, and then sends price straight back into resistance to see who’s really in control.
AI Ranks LINK and SOL as Top 2026 Bets, Flags ADA as a Risk_**
RSI Is Helping the Bullish Case, But Proof Still Matters
Momentum indicators are starting to lean in favor of the bulls. On the RSI, the price was drifting lower into late December, but RSI was quietly making higher lows.
That bullish divergence often shows up when selling pressure is fading, even if the price hasn’t flipped direction yet.
Now RSI is rising along with price, which supports the idea that this bounce has some substance. Still, divergence alone isn’t enough. ADA needs to actually break and hold resistance to turn momentum into a trend.
What’s Next for ADA?
Everything revolves around $0.40. A bright breakout past that point and a hold would be a strong move. The levels to watch after that would be around the $0.45 mark, with the large psychological level at $0.50 following.
As long as 0.40 acts as a resistance level, attention turns once again to support. The first area to watch is around $0.37, followed by $0.35. Below that, the low $0.30s remain the deeper support zone that buyers don’t want to see tested again.
For now, the ADA price is doing what it needs to do. The bounce looks strong, RSI supports the move, and the price is pressing into the exact level that can change the tone of the chart.
What happens around $0.40 over the next few candles should tell the story of whether this move has real legs or needs more time to develop.
Disclaimer: The information on this page may come from third parties and does not represent the views or opinions of Gate. The content displayed on this page is for reference only and does not constitute any financial, investment, or legal advice. Gate does not guarantee the accuracy or completeness of the information and shall not be liable for any losses arising from the use of this information. Virtual asset investments carry high risks and are subject to significant price volatility. You may lose all of your invested principal. Please fully understand the relevant risks and make prudent decisions based on your own financial situation and risk tolerance. For details, please refer to
Disclaimer.
Articoli correlati
Altcoin XRP Forms Elliott Wave on the Weekly Price Chart, Potential Bullish Divergence Ahead?
Altcoin XRP forms Elliott Wave on the weekly price chart.
A potential bullish divergence lies ahead for XRP price.
Can Ripple’s XRP go on to set a new ATH this year?
Several altcoins continue to show promising price pump indicators across their various price charts, allowing analysts t
CryptoNewsLand24m fa
BTC 15分钟下跌0.52%:鲸鱼集中流入交易所叠加流动性不足放大卖压
2026-04-17 10:15 至 2026-04-17 10:30(UTC),BTC价格在75214.3 – 75725.9 USDT区间快速走低,15分钟累计收益率-0.52%,振幅达到0.68%。该时段市场情绪由谨慎转向悲观,盘面波动加剧,主流交易对出现主动卖盘放量,买盘承接受限,交易景气度显著下降。
本次异动的主要驱动力是大额持仓者(鲸鱼)向交易所的短线集中流入,链上数据表明单地址持有
GateNews2h fa
Popular Analyst Remains Aggressively Bullish on Crypto Prices, Predicts Parabolic Surges Soon
Popular analyst remains aggressively bullish on crypto prices.
The expert then predicts parabolic surges soon.
The move could spark dead coins into pumping heavily as well.
The crypto community continues to hold
CryptoNewsLand2h fa
RAVE, SIREN Rally Despite Manipulation Warnings
Rave DAO and Siren tokens surged to near all-time highs, facing volatility and liquidation risks. Concerns grew over potential market manipulation and supply concentration, particularly for RAVE. A new KuCoin listing boosted RAVE's visibility, despite inherent trading risks.
CryptoFrontier2h fa
ETH 15分钟上涨0.65%:ETF资金流入与杠杆加仓共振推高现货价格
2026-04-17 09:15 至 2026-04-17 09:30(UTC)期间,ETH在2351.53至2376.99 USDT区间波动,15分钟收益率实现+0.65%,振幅为1.08%。该区间内买盘力量显著增强,中等规模订单成交占主导,带动市场关注度和短线波动加剧。
本次异动的主要驱动力是机构资金通过ETH现货ETF持续流入,尤其近4日累计净流入超过2.12亿美元,4月17日当日ETF
GateNews3h fa
BTC 15分钟上涨0.58%:交易所净流出与ETF买盘共振推升价格
2026-04-17 08:45 至 2026-04-17 09:00(UTC)期间,BTC价格短线拉升,K线收益率+0.58%,价格区间75265.0 - 75862.3 USDT,振幅0.79%。市场波动放大,关注度提升,交易量较平时显著增加,反映资金流动与技术面信号共振。
本次异动的主要驱动力是交易所BTC净流出与ETF资金同步流入。数据显示,24小时内交易所净流出2,844.68 BT
GateNews3h fa
