
Date: Fri, Dec 26, 2025 | 06:30 PM GMT
The broader cryptocurrency market has been navigating a period of choppy and uncertain price action over the past several weeks, a phase that began after the sharp market-wide sell-off on October 10. During that correction, Ethereum (ETH) dropped nearly 28% over the last 60 days, applying sustained pressure across the altcoin sector — including ether.fi (ETHFI).
ETHFI has mirrored this weakness, sliding more than 31% over the same period. However, despite the sharp downtrend, recent price behavior suggests selling pressure may be easing. The token is now trading near a historically significant demand zone, where buyers have repeatedly stepped in before — raising the possibility that ETHFI could be approaching an inflection point.
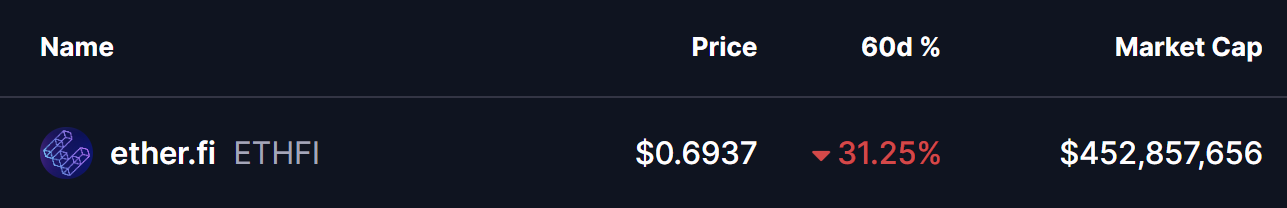
Source: Coinmarketcap
Double Bottom Pattern in Focus
On the daily timeframe, ETHFI appears to be forming a potential double-bottom structure — a classic reversal pattern that often signals exhaustion among sellers. The setup began after ETHFI was rejected from the $0.9233 resistance area, a move that triggered a sharp decline of nearly 28% and pushed price back toward the lower end of its range.
That sell-off dragged ETHFI into the $0.65 support zone, a level that has consistently acted as a strong demand area in the past. The chart now shows price revisiting this same region and stabilizing once again, suggesting buyers are actively defending it. The similarity between the first and second lows strengthens the case that a double-bottom base may be forming.
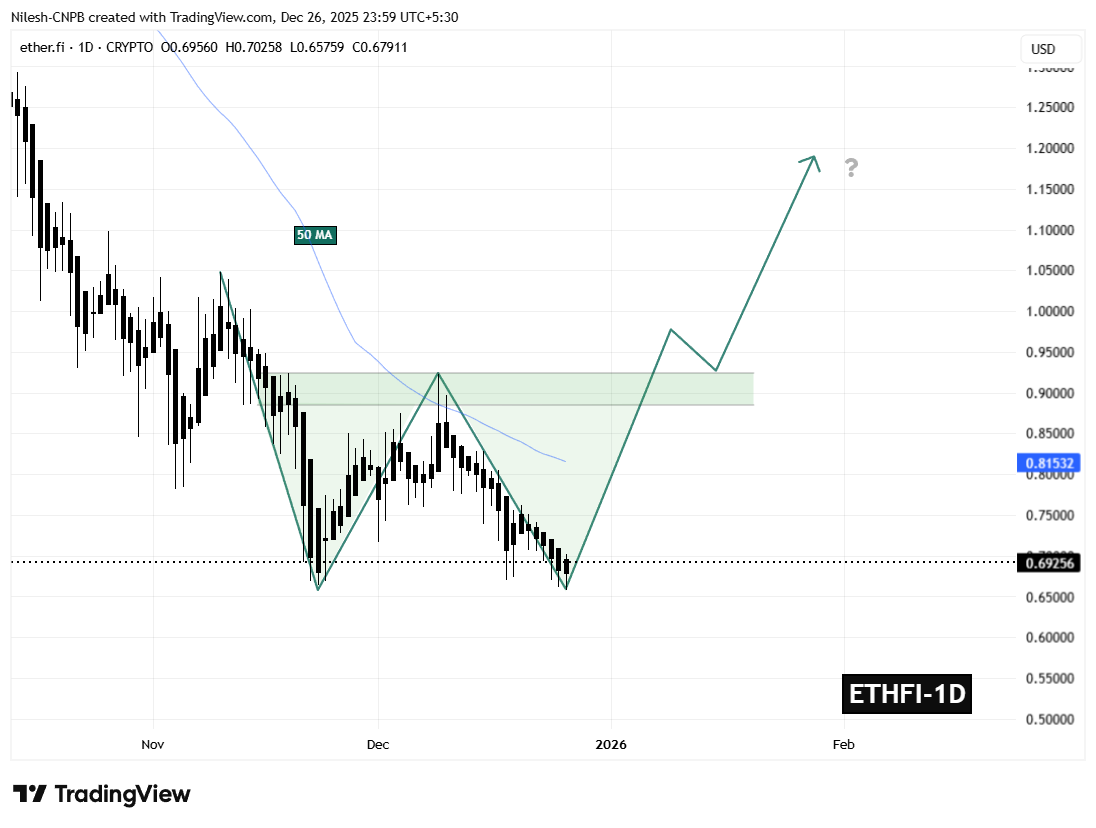
ETHFI Daily Chart/Coinsprobe (Source: Tradingview)
If this support continues to hold, the ongoing consolidation could mark the completion of the second bottom — a critical step in shifting momentum away from sellers and toward a potential trend reversal.
What’s Next for ETHFI?
The $0.65 support zone remains the most important level to monitor in the near term. As long as ETHFI holds above this area, the developing bullish structure remains valid and provides room for momentum to gradually rebuild.
On the upside, the first major challenge sits at the 50-day moving average near $0.8153. This level has repeatedly capped recovery attempts throughout the recent downtrend and now represents the initial test for buyers. A sustained move above this moving average would signal improving market structure and growing bullish confidence.
Beyond that, the $0.9233 neckline stands as the key confirmation level. A decisive breakout above this resistance would complete the double-bottom pattern and significantly strengthen the bullish outlook, potentially opening the door for a broader recovery move in the weeks ahead.
For now, ETHFI finds itself at a technically pivotal zone — one that could either reinforce the existing downtrend or mark the beginning of a meaningful rebound if buyers continue to defend support.
Disclaimer: The views and analysis presented in this article are for informational purposes only and reflect the author’s perspective, not financial advice. Technical patterns and indicators discussed are subject to market volatility and may or may not yield the anticipated results. Investors are advised to exercise caution, conduct independent research, and make decisions aligned with their individual risk tolerance.
Disclaimer: The information on this page may come from third parties and does not represent the views or opinions of Gate. The content displayed on this page is for reference only and does not constitute any financial, investment, or legal advice. Gate does not guarantee the accuracy or completeness of the information and shall not be liable for any losses arising from the use of this information. Virtual asset investments carry high risks and are subject to significant price volatility. You may lose all of your invested principal. Please fully understand the relevant risks and make prudent decisions based on your own financial situation and risk tolerance. For details, please refer to
Disclaimer.
Articoli correlati
BTC 分析师 Killa:比较历史周期,BTC 可能在确立真正底部前再现一波下跌
Gate News 消息,4 月 11 日,BTC 分析师 Killa 发文表示,比较所有先前的比特币周期,每个周期均包含以投降式底部结束的最终下跌。本周期中,峰值出现的时间早于以往周期。Killa 指出,若历史重演,在确立真正底部之前,BTC 可能还会出现一波下跌。
GateNews25m fa
BTC 15分钟下跌0.45%:现货主动抛压主导,杠杆资金观望未加剧波动
2026-04-11 13:00至13:15(UTC),BTC于短线内收益率录得-0.45%,价格区间72526.3至72935.7 USDT,15分钟振幅为0.56%。市场整体关注度保持高位,波动虽未极端但下行压力明显,短线多空分歧加剧。
本次异动的主要驱动力是现货市场的主动性抛压。该时段现货与永续合约总成交量环比提升约12%,盘口数据显示卖单挂单小幅上升、买单撤单提速,流动性短时收缩,触发
GateNews1h fa
美伊冲突下比特币市场现分化:机构持续买入,鲸鱼与矿企加速抛售
在美伊地缘冲突影响下,比特币市场出现分化:机构投资者继续吸纳比特币,而鲸鱼、矿企及部分国家则减持。数据显示,大型持有者转为净卖出,矿企抛售显著,主权持有国也明显减仓。尽管市场情绪低迷,但比特币价格维持在6.5万至7.3万美元区间,未来走势依赖于机构资金的持续流入。
GateNews1h fa
市場過度恐慌?微策略創辦人:比特幣已觸底、量子威脅杞人憂天
Michael Saylor 斷言比特幣已在 6 萬美元時完成築底,並認為對量子電腦威脅的擔憂過度。他預測未來比特幣將成為數位信貸體系的核心,並提到市場賣壓有限,有望推動新一波牛市。瑞穗則對其公司未來表現持正面評估。
CryptoCity2h fa
Crypto Market Surges to $2.44T Amid Growing Momentum
The crypto market has grown, with a 1.35% increase in capitalization to $2.44T and Bitcoin and Ethereum prices rising. Major gainers include $PENGU, $HBTC, and $TSLA. DeFi TVL rose 1.27%, while NFT sales fell 4.99%. Key developments include Polymarket's stablecoin upgrade and CFTC's regulatory efforts.
BlockChainReporter3h fa
Pepe Price Holds Steady as ETF Filing Lifts Market Attention
Canary Capital’s ETF filing enhances Pepe Coin's institutional appeal, although trader participation declines, impacting derivatives activity. Price movements hinge on key levels of support and resistance as the market faces mixed sentiment.
CryptoNewsLand3h fa
