
Date: Sun, Dec 21 2025 | 08:56 AM GMT
The broader cryptocurrency market has remained under pressure over the past several weeks, following the sharp sell-off that began on October 10. That corrective phase dragged Ethereum (ETH) down by nearly 23% over the last 60 days and weighed heavily on overall market sentiment. While many altcoins have struggled to stabilize, Quant (QNT) has shown relative resilience, posting only a modest decline and holding above a historically important support zone.
From a technical perspective, the daily chart suggests that QNT may be approaching a critical decision point, with price action forming a recognizable structure that could influence its next directional move.
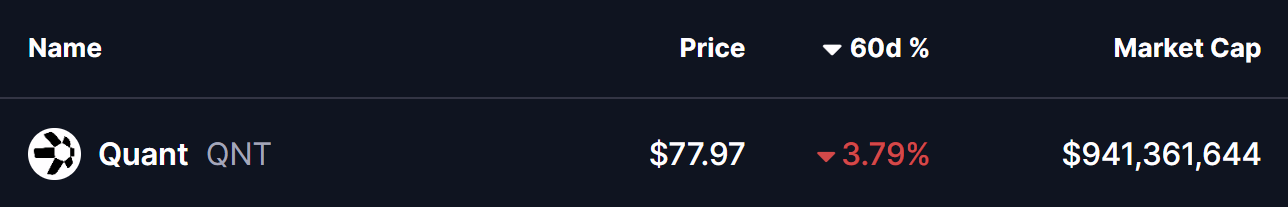
Source: Coinmarketcap
Head and Shoulders Pattern Takes Shape
On the daily timeframe, QNT appears to be carving out a head and shoulders formation, a well-known pattern that often signals a potential trend shift once the neckline is tested. Earlier in the structure, QNT formed the left shoulder before rallying sharply to its head near the $100 region. From there, price reversed lower and slid back toward the neckline, located around the $70 support zone.
This $70 area has proven to be a strong demand zone in the past, repeatedly attracting buyers and preventing deeper declines. The recent move into this region was met with a noticeable reaction, as reflected by the long lower wick on the chart. That rejection from support pushed price back toward the $78 level, suggesting that buyers are actively defending the neckline and potentially forming the right shoulder of the pattern.
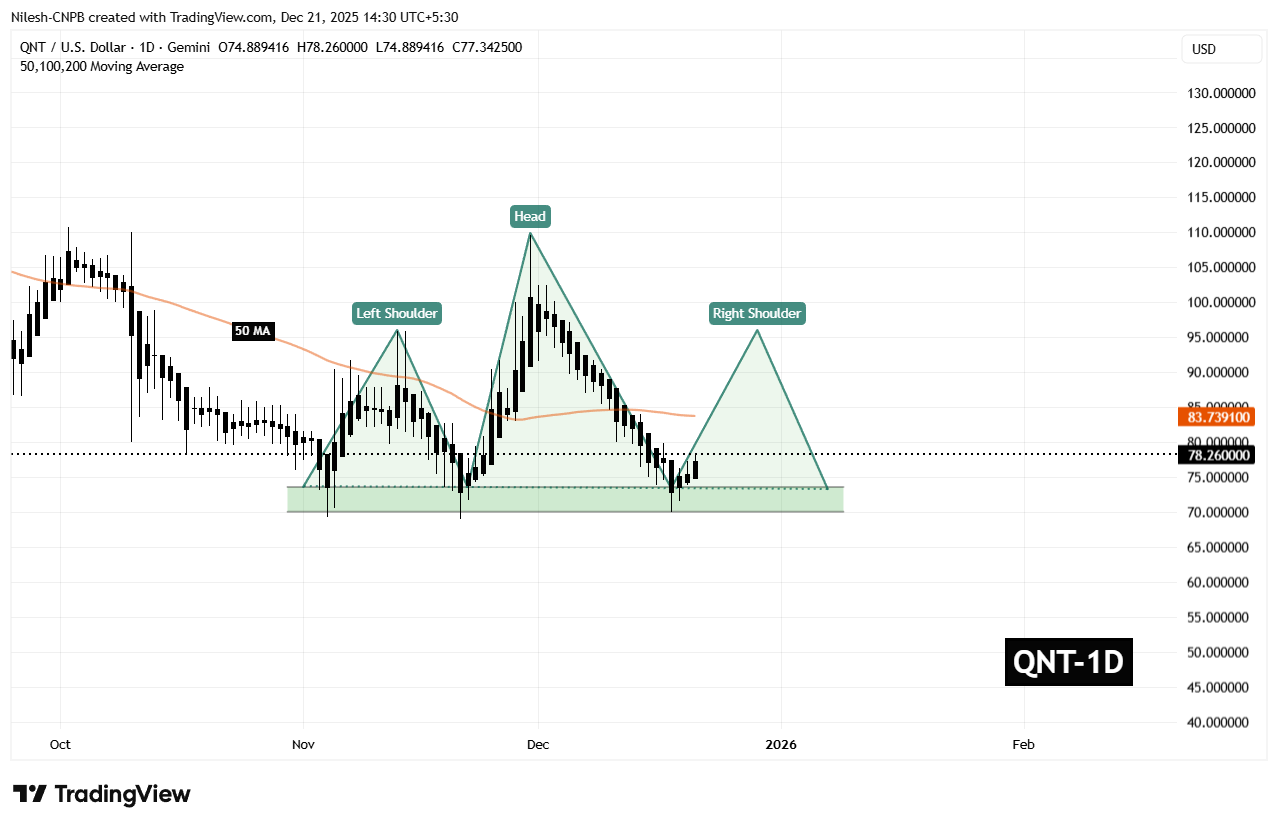
Quant (QNT) Daily Chart/Coinsprobe (Source: Tradingview)
The behavior around this zone is critical. A successful defense of the neckline often opens the door for a relief rally, especially if broader market conditions stabilize.
What’s Next for QNT?
For bullish momentum to build, QNT needs to reclaim the 50-day moving average, currently sitting near $83.73. This level now acts as a key short-term resistance, and a daily close above it would signal a shift in momentum back in favor of buyers.
If that recovery unfolds, the chart points toward a potential move into the $95.90 region. Such a move would represent a rebound of roughly 22% from current levels and align with the typical reaction seen during the right-shoulder phase of this pattern. A rally of this nature would not only ease recent selling pressure but also place QNT back into a more neutral technical posture.
That said, the setup remains delicate. If the $70 neckline support fails to hold on a sustained basis, the head and shoulders structure would remain bearish, opening the door to further downside and extending the corrective phase. For now, all eyes remain on how price behaves around this key support and whether buyers can regain control above the moving average.
Disclaimer: The views and analysis presented in this article are for informational purposes only and reflect the author’s perspective, not financial advice. Technical patterns and indicators discussed are subject to market volatility and may or may not yield the anticipated results. Investors are advised to exercise caution, conduct independent research, and make decisions aligned with their individual risk tolerance.
Disclaimer: The information on this page may come from third parties and does not represent the views or opinions of Gate. The content displayed on this page is for reference only and does not constitute any financial, investment, or legal advice. Gate does not guarantee the accuracy or completeness of the information and shall not be liable for any losses arising from the use of this information. Virtual asset investments carry high risks and are subject to significant price volatility. You may lose all of your invested principal. Please fully understand the relevant risks and make prudent decisions based on your own financial situation and risk tolerance. For details, please refer to
Disclaimer.
Articoli correlati
Bitcoin's Next Critical Test at $79K, Next 3-6 Weeks Will Determine Bottom Formation: Analyst Willy Woo
Gate News message, April 28 — Crypto analyst Willy Woo shared on X that Bitcoin's next critical test is whether it can effectively break through the recent cost basis of investors at approximately $79,000. Woo estimates the probability of a successful breakout at around 30%. If Bitcoin holds
GateNews56m fa
美伊局势再生变故:布伦特原油突破 108 美元,加密市场承压
美伊谈判陷入僵局,霍尔木兹海峡紧张推高油价,比特币跌破 7.7 万美元。本文分析地缘风险如何通过宏观预期与资金流动传导至加密市场。
GateInstantTrends3h fa
Solana Dominates DEX Spot Trading in Q1 2026 with 30.6% Market Share
Gate News message, April 28 — Solana maintained its leading position in DEX spot trading during Q1 2026 with a 30.6% market share, despite a 26.5% quarter-over-quarter decline in trading volume.
Ethereum
GateNews3h fa
Arthur Hayes:戰爭開支向市場注入大量資金,比特幣年底達 12.5 萬美元
Maelstrom 首席投資官 Arthur Hayes 於 4 月 27 日在 2026 年比特幣拉斯維加斯大會現場演講中表示,他已轉為比特幣看漲立場,並預測比特幣年底將達到 12.5 萬美元,受 AI 驅動隱性信貸通縮、聯準會向新任主席 Kevin Warsh 政策交接,以及美國商業銀行吸收政府債務的結構性轉變。
MarketWhisper5h fa
Gold and Oil Gain Modestly; Bitcoin and Ethereum Volatility Indices Decline
Gate News message, April 28 — Gold prices rose to $4,693.08 per ounce, up 0.24% intraday, while silver climbed to $75.876 per ounce, gaining 0.53%.
BVIX (Bitcoin volatility index) stood at 41.67, down 0.10% intraday. EVIX (Ethereum volatility index) was at 59.90, declining 2.12%.
On the currency
GateNews5h fa
Bitcoin Rises to $80K Amid Declining Trading Volume and Negative Funding Rates
Gate News message, April 28 — Bitcoin's rise toward $80,000 is accompanied by a significant drop in trading volume and deeply negative funding rates, raising questions about the sustainability of the rally, according to Markus Thielen, research head at 10x Research.
Bitcoin's weekly trading volume
GateNews5h fa