- Bitcoin is currently hovering around the $90.3K mark.
- BTC’s daily trading volume has surged by over 44%.
With the fear sentiment across the crypto market, the majority of the tokens are charted in red, while a very few are in green. The market is fluctuating between losses and gains. Meanwhile, the largest asset, Bitcoin (BTC), has been stuck in the bear trap, despite multiple recovery attempts
BTC could reach $95K once the potential bulls assert dominance. As of today, in the early hours, the asset traded at a high range of $92,721.77. With the bearish command talks, the price fell back to a bottom level of $89,532.60. As per CMC data, Bitcoin has posted a 2.09% loss and is currently trading at $90,313
In addition, the market cap of the asset is resting at $1.8 trillion, with the daily trading volume having surged by over 44.69%, reaching the $83.1 billion mark. The Coinglass data has reported that the market has experienced a liquidation of $71.83 million worth of Bitcoin during the last 24 hours
Which Way Is Bitcoin Headed Next: Higher or Lower?
Bitcoin’s Moving Average Convergence Divergence (MACD) line has crossed below the zero line, which implies the broader trend is bearish. However, with the signal line positioned above the zero line, the momentum is trying to shift upward
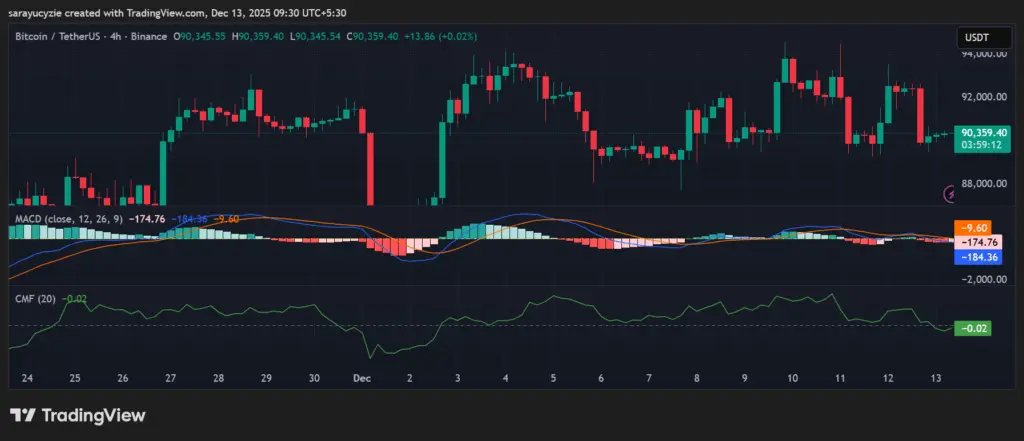 *BTC chart (Source: TradingView)*Moreover, the Chaikin Money Flow (CMF) indicator of BTC at -0.02 hints at weak selling pressure. The value is slightly below zero, showing the outflow of money, reflecting indecision, with neither buyers nor sellers in firm control.
If Bitcoin’s bearish command strengthens, it might push the price down to test its support at around $90,248. Further correction on the downside could trigger the death cross emergence, likely sending the asset’s price below the $90,113 range
Assuming the asset’s price got charted in green, the nearby resistance would be hit at the $90,451 level. An extended bullish pressure might initiate the golden cross to take action, and drive the Bitcoin price up to revisit its recent high above $90,579
Furthermore, Bitcoin’s daily Relative Strength Index (RSI) found at 45.45 indicates a neutral to slightly bearish sentiment. Notably, the current market momentum holds with no strong trend confirmed. BTC’s Bull Bear Power (BBP) value of -1,171.64 suggests strong bearish dominance. A deep negative value puts the sellers firmly in control, and the downtrend may continue unless the buyers step in.
Top Updated Crypto News
Fartcoin Gasps Higher: Will the 12% Rally Push for the Next Wave Upward?
Disclaimer: The information on this page may come from third parties and does not represent the views or opinions of Gate. The content displayed on this page is for reference only and does not constitute any financial, investment, or legal advice. Gate does not guarantee the accuracy or completeness of the information and shall not be liable for any losses arising from the use of this information. Virtual asset investments carry high risks and are subject to significant price volatility. You may lose all of your invested principal. Please fully understand the relevant risks and make prudent decisions based on your own financial situation and risk tolerance. For details, please refer to
Disclaimer.
