2025 MSQ Price Prediction: Analyzing Market Trends and Potential Growth Factors
Introduction: MSQ's Market Position and Investment Value
MSQUARE (MSQ) has established itself as a token for real economy platforms since its inception in 2022, achieving significant milestones in the development of multiple service platforms. As of 2025, MSQ's market capitalization has reached $68,337,835, with a circulating supply of approximately 15,155,874 tokens, and a price hovering around $4.509. This asset, often referred to as a "real economy enabler," is playing an increasingly crucial role in real estate information services, advertising, and global talent acquisition.
This article will provide a comprehensive analysis of MSQ's price trends from 2025 to 2030, considering historical patterns, market supply and demand, ecosystem development, and macroeconomic factors to offer professional price predictions and practical investment strategies for investors.
I. MSQ Price History Review and Current Market Status
MSQ Historical Price Evolution
- 2022: MSQ launched at $1, marking its entry into the crypto market
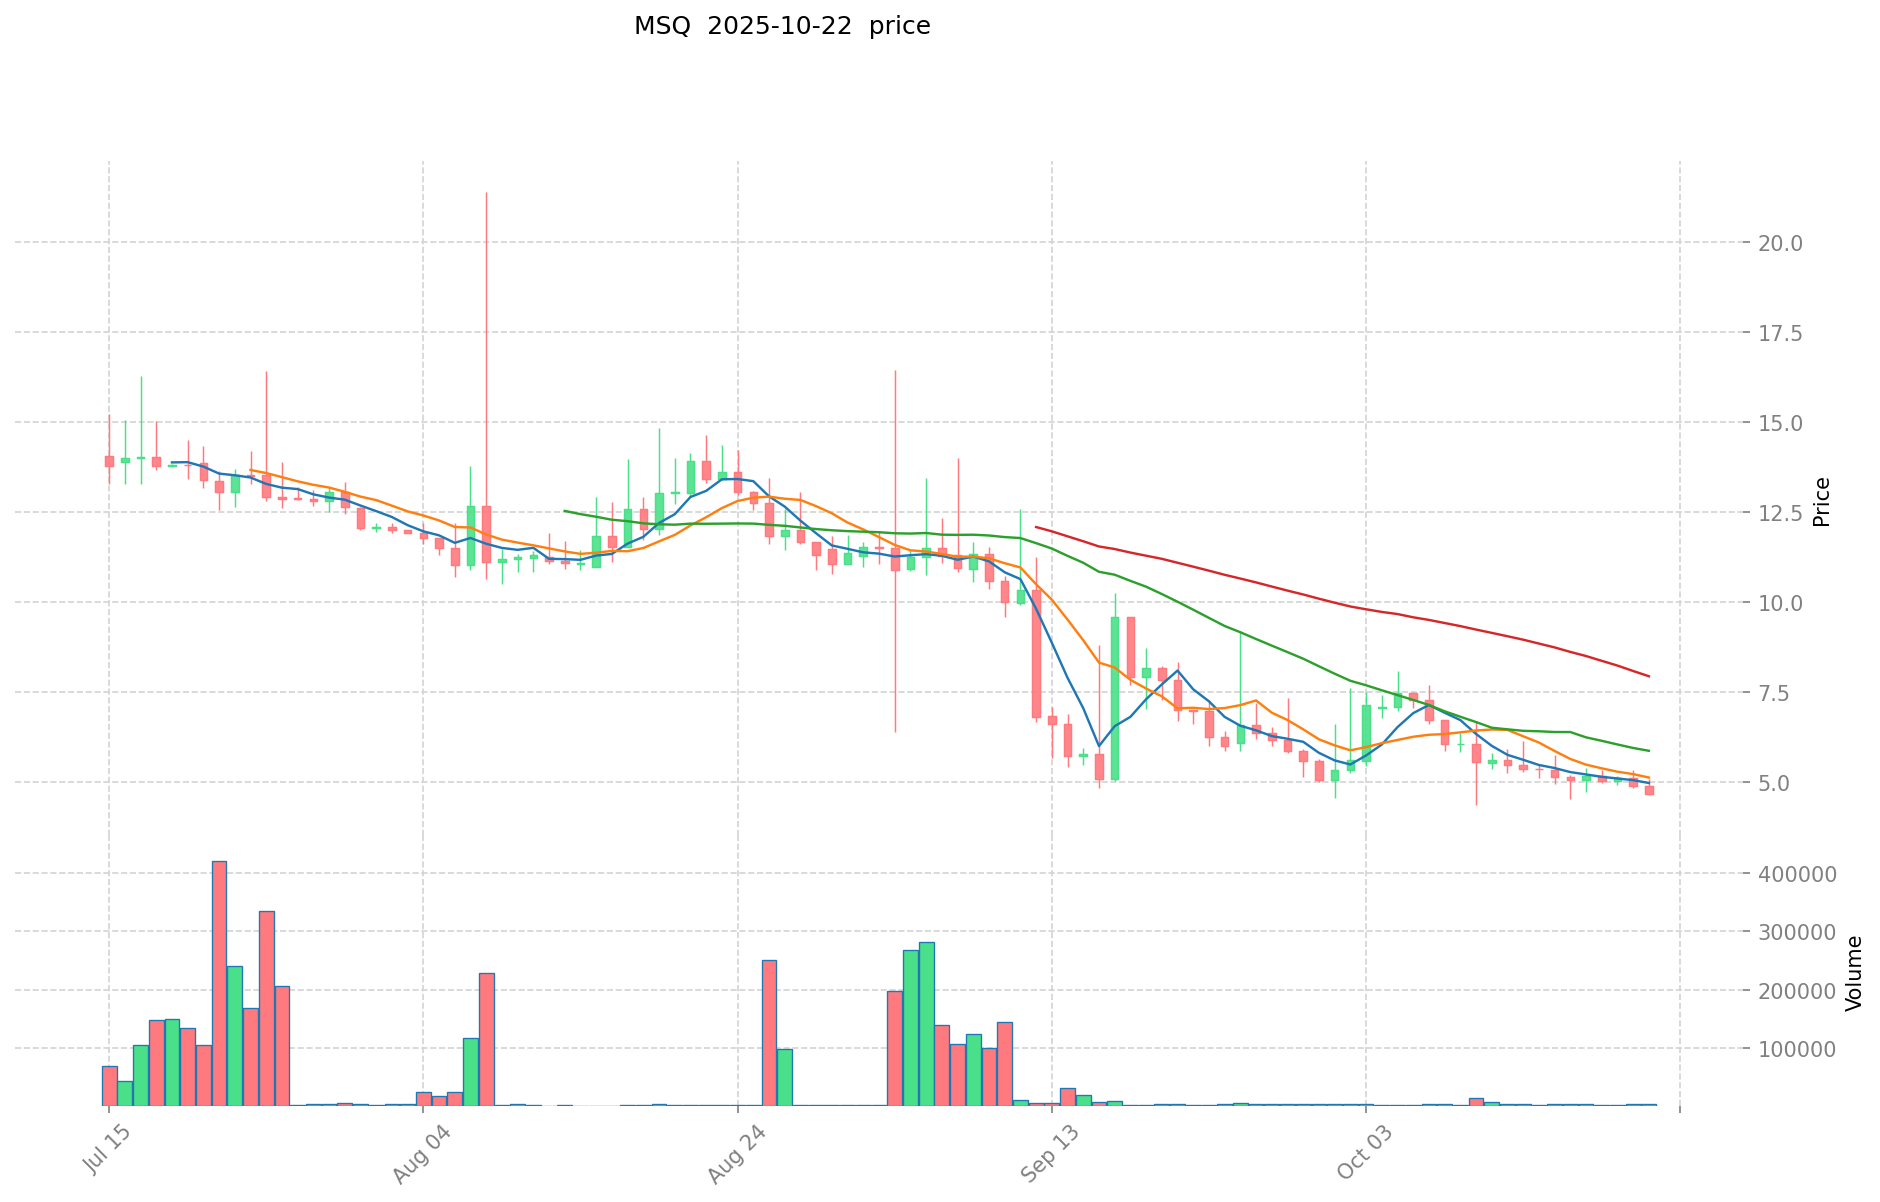
- 2024: Reached all-time low of $1.027 on October 6, showing significant market volatility
- 2025: Hit all-time high of $24 on May 26, demonstrating substantial growth potential
MSQ Current Market Situation
As of October 22, 2025, MSQ is trading at $4.509, experiencing a 5.7% decline in the past 24 hours. The token has seen significant downward pressure over various timeframes, with a 14.24% decrease in the past week and a substantial 32.92% drop over the last month. The current price represents a 81.21% decline from its all-time high of $24, indicating a bearish trend in the short to medium term.
MSQ's market capitalization stands at $68,337,835, ranking it 508th in the overall cryptocurrency market. With a circulating supply of 15,155,874 MSQ tokens out of a total supply of 25,916,431, the token has a circulation ratio of 58.38%. The fully diluted market cap is $117,060,092, suggesting potential for future growth if market conditions improve.
Trading volume in the past 24 hours is relatively low at $16,486, which may indicate limited liquidity and potential for price volatility. The market sentiment appears cautious, with the current price closer to its all-time low than its all-time high.
Click to view the current MSQ market price
MSQ Market Sentiment Indicator
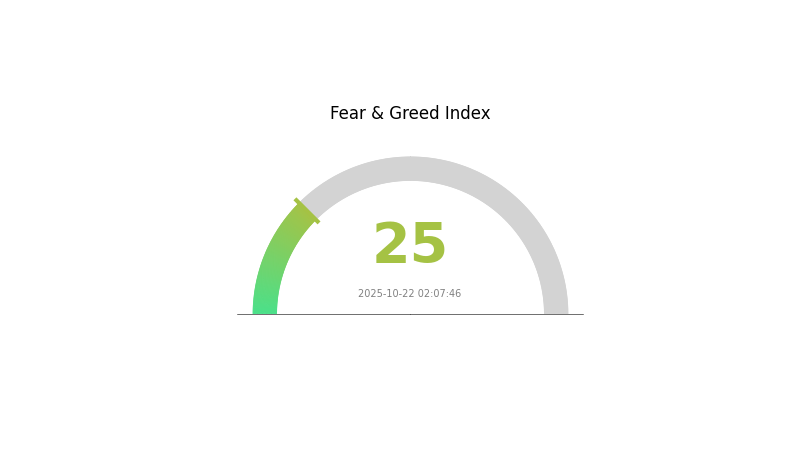
2025-10-22 Fear and Greed Index: 25 (Extreme Fear)
Click to view the current Fear & Greed Index
The crypto market is currently gripped by extreme fear, with the Fear and Greed Index plummeting to 25. This sentiment often signals a potential buying opportunity for contrarian investors. However, it's crucial to approach with caution and conduct thorough research. While fear may indicate oversold conditions, it can also precede further market declines. Savvy traders on Gate.com are closely monitoring this indicator, ready to capitalize on potential market reversals or continued downtrends.
MSQ Holdings Distribution
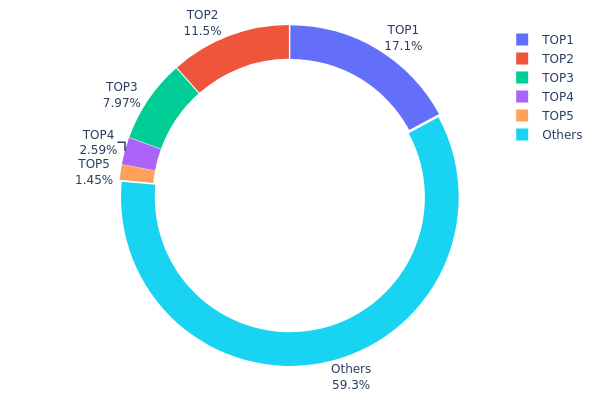
The address holdings distribution data for MSQ reveals a moderately concentrated ownership structure. The top address holds 17.14% of the total supply, while the top 5 addresses collectively control 40.67% of MSQ tokens. This level of concentration suggests a significant influence from a small group of large holders, commonly referred to as "whales" in the cryptocurrency market.
While not excessively centralized, this distribution pattern could potentially impact market dynamics. The presence of large holders may contribute to increased price volatility, as their trading activities could have outsized effects on the market. However, with nearly 60% of tokens distributed among other addresses, there is still a substantial level of decentralization, which could help mitigate some of the risks associated with high concentration.
This current distribution reflects a market structure that balances between centralized influence and broader participation. It suggests a maturing ecosystem for MSQ, but also highlights the need for ongoing monitoring of large holders' activities to assess potential market impacts.
Click to view the current MSQ Holdings Distribution
| Top | Address | Holding Qty | Holding (%) |
|---|---|---|---|
| 1 | 0xee3e...ddca37 | 4442.54K | 17.14% |
| 2 | 0x69c5...0344a5 | 2989.04K | 11.53% |
| 3 | 0x5a58...e93fde | 2064.26K | 7.96% |
| 4 | 0xef96...7c2c61 | 671.84K | 2.59% |
| 5 | 0x3fa4...a16b56 | 376.76K | 1.45% |
| - | Others | 15371.99K | 59.33% |
II. Key Factors Influencing Future MSQ Price
Supply Mechanism
- Market Volatility: The cryptocurrency market's high volatility significantly impacts MSQ's price.
- Historical Pattern: Past market trends show that price fluctuations in the crypto market can lead to rapid changes in MSQ's value.
- Current Impact: The ongoing market volatility continues to be a major factor in determining MSQ's short-term price movements.
Institutional and Whale Dynamics
- Corporate Adoption: The adoption of MSQ by known enterprises could potentially influence its price and market perception.
- Government Policies: National-level policies related to cryptocurrencies may impact MSQ's regulatory environment and market acceptance.
Macroeconomic Environment
- Inflation Hedging Properties: MSQ's performance in inflationary environments may affect its attractiveness as an investment asset.
- Geopolitical Factors: International geopolitical situations can influence the overall cryptocurrency market, including MSQ.
Technical Development and Ecosystem Building
- Ecosystem Applications: The development of main DApps and ecosystem projects related to MSQ could drive its utility and value.
III. MSQ Price Prediction for 2025-2030
2025 Outlook
- Conservative prediction: $3.87 - $4.45
- Neutral prediction: $4.45 - $5.00
- Optimistic prediction: $5.00 - $5.25 (requires strong market recovery and increased adoption)
2027-2028 Outlook
- Market stage expectation: Potential growth phase with increasing adoption
- Price range forecast:
- 2027: $5.45 - $8.23
- 2028: $6.12 - $9.25
- Key catalysts: Technological advancements, expanding use cases, and broader market acceptance
2030 Long-term Outlook
- Base scenario: $9.56 - $10.50 (assuming steady growth and adoption)
- Optimistic scenario: $10.50 - $11.85 (assuming accelerated adoption and favorable market conditions)
- Transformative scenario: $11.85+ (assuming breakthrough applications and mainstream integration)
- 2030-12-31: MSQ $11.85 (potential peak based on optimistic projections)
| 年份 | 预测最高价 | 预测平均价格 | 预测最低价 | 涨跌幅 |
|---|---|---|---|---|
| 2025 | 5.25336 | 4.452 | 3.87324 | -1 |
| 2026 | 6.50259 | 4.85268 | 3.20277 | 7 |
| 2027 | 8.23257 | 5.67764 | 5.45053 | 25 |
| 2028 | 9.25029 | 6.9551 | 6.12049 | 54 |
| 2029 | 11.01967 | 8.1027 | 6.48216 | 79 |
| 2030 | 11.85586 | 9.56118 | 6.5016 | 112 |
IV. MSQ Professional Investment Strategies and Risk Management
MSQ Investment Methodology
(1) Long-term Holding Strategy
- Suitable for: Long-term investors and believers in MSQUARE's ecosystem
- Operation suggestions:
- Accumulate MSQ tokens during market dips
- Stay updated with MSQUARE's platform developments
- Store tokens in a secure wallet
(2) Active Trading Strategy
- Technical analysis tools:
- Moving Averages: Use to identify trends and potential reversal points
- RSI (Relative Strength Index): Helps in identifying overbought or oversold conditions
- Key points for swing trading:
- Monitor platform usage metrics for potential price catalysts
- Set stop-loss orders to manage downside risk
MSQ Risk Management Framework
(1) Asset Allocation Principles
- Conservative investors: 1-3% of crypto portfolio
- Aggressive investors: 5-10% of crypto portfolio
- Professional investors: Up to 15% of crypto portfolio
(2) Risk Hedging Solutions
- Diversification: Spread investments across different crypto assets
- Stop-loss orders: Implement to limit potential losses
(3) Secure Storage Solutions
- Hardware wallet recommendation: Gate Web3 wallet
- Software wallet option: Official MSQUARE wallet (if available)
- Security precautions: Enable two-factor authentication, use strong passwords
V. Potential Risks and Challenges for MSQ
MSQ Market Risks
- Volatility: Cryptocurrency markets are highly volatile
- Competition: Other platforms may emerge offering similar services
- Adoption risk: Slow uptake of MSQUARE's platforms could impact token value
MSQ Regulatory Risks
- Regulatory uncertainty: Changing regulations could impact MSQ's utility
- Cross-border challenges: International regulations may affect global operations
- Compliance costs: Adapting to new regulations could increase operational costs
MSQ Technical Risks
- Smart contract vulnerabilities: Potential for exploits in the token contract
- Scalability issues: Platform growth may face technical limitations
- Blockchain network congestion: Could affect transaction speeds and costs
VI. Conclusion and Action Recommendations
MSQ Investment Value Assessment
MSQ presents a unique value proposition through its real-world utility in MSQUARE's ecosystem. Long-term potential exists if platform adoption grows, but short-term volatility and adoption risks remain significant.
MSQ Investment Recommendations
✅ Beginners: Consider small, long-term positions after thorough research ✅ Experienced investors: Implement dollar-cost averaging strategy with strict risk management ✅ Institutional investors: Conduct in-depth due diligence and consider MSQ as part of a diversified crypto portfolio
MSQ Trading Participation Methods
- Spot trading: Available on Gate.com for direct token purchases
- Staking: Explore staking options if offered by MSQUARE or partnered platforms
- Platform usage: Utilize MSQ within MSQUARE's ecosystem to understand its utility
Cryptocurrency investments carry extremely high risks, and this article does not constitute investment advice. Investors should make decisions carefully based on their own risk tolerance and are advised to consult professional financial advisors. Never invest more than you can afford to lose.
FAQ
What is the price prediction for Mog coin in 2040?
Based on current projections, Mog coin's price in 2040 could reach a maximum of $0.000497, with a potential low of $0.000385. The average trading price is uncertain.
What crypto has the highest price prediction?
Bitcoin is predicted to reach the highest price by 2026, potentially hitting significant new milestones according to expert analysis.
What is the price prediction for Decentraland in 2030?
Based on current market trends and projections, Decentraland is predicted to reach a maximum price of $2.14 in early 2030, with a potential dip to $2.09 by the end of the year.
What is the price prediction for XRP 2025?
XRP is predicted to reach $2.60-$2.80 by October 2025, assuming bulls reclaim the $2.30-$2.35 range with strong trading volume.
Share
Content