Trade
Trading Type
Spot
Trade crypto freely
Alpha
Points
Get promising tokens in streamlined on-chain trading
Pre-Market
Trade new tokens before they are officially listed
Margin
Magnify your profit with leverage
Convert & Block Trading
0 Fees
Trade any size with no fees and no slippage
Leveraged Tokens
Get exposure to leveraged positions simply
Futures
Futures
Points
Hundreds of contracts settled in USDT or BTC
Options
HOT
Trade European-style vanilla options
Unified Account
Maximize your capital efficiency
Demo Trading
Futures Kickoff
Get prepared for your futures trading
Futures Events
Participate in events to win generous rewards
Demo Trading
Use virtual funds to experience risk-free trading
Earn
Launch
CandyDrop
Collect candies to earn airdrops
Launchpool
Quick staking, earn potential new tokens
HODLer Airdrop
Hold GT and get massive airdrops for free
Launchpad
Be early to the next big token project
Alpha Points
New
Trade on-chain assets and enjoy airdrop rewards!
Futures Points
New
Earn futures points and claim airdrop rewards
Investment
Simple Earn
Earn interests with idle tokens
Auto-Invest
Auto-invest on a regular basis
Dual Investment
Buy low and sell high to take profits from price fluctuations
Soft Staking
Earn rewards with flexible staking
Crypto Loan
0 Fees
Pledge one crypto to borrow another
Lending Center
One-stop lending hub
VIP Wealth Hub
Customized wealth management empowers your assets growth
Private Wealth Management
Customized asset management to grow your digital assets
Quant Fund
Top asset management team helps you profit without hassle
Staking
Stake cryptos to earn in PoS products
BTC Staking
HOT
Stake BTC and earn 10% APR
GUSD Minting
Use USDT/USDC to mint GUSD for treasury-level yields
More
Gate Wiki
Gate Wiki empowers users with accessible crypto and blockchain knowledge, delivering trusted token research, industry analysis, trend forecasts, and market insights.

Gate Wiki Topics
Topics
Bitcoin
Ethereum
XRP
Tether
Solana
BNB
Doge
ADA
USDC
TRON
Shiba Inu
Toncoin
Memecoins
AI
RWA
Gaming
DePIN
Altcoins
Blockchain
DeFi
GameFi
Metaverse Crypto
NFTs
Trading Fee
P2P Trading
Stablecoin
Crypto Insights
Investing In Crypto
Crypto staking
Spot Trading
Web 3.0
Crypto Trading
New Cryptocurrencies
Crypto Tutorial
Trading Bots
BRC-20
DAO
Macro Trends
SocialFi
Liquid Staking
Zero-Knowledge Proof
Airdrop
Crypto Ecosystem
Layer 2
Payments
Mining
How to buy crypto
Web3 wallet
Crypto glossary
ETF
Futures Trading
Crypto Loans
Crypto Deposit
Crypto Withdrawal
Bitcoin Halving
Cryptocurrency market
Grid Bot
Inscriptions
K-line
Telegram Mini App
P2E
Cosmos
PoW
CTA
Top crypto
Pre-Market
Price Prediction
xstocks
Pi Network
Weekly Report
In-Depth Research
Investment News
Perp DEX
GUSD
Launchpad
The Latest News
TradFi
Options

What is tokenomics and how does token allocation, inflation control, and burn mechanisms work in crypto projects
This comprehensive guide explores tokenomics fundamentals through BNB's real-world implementation. It examines how 200 million tokens are strategically allocated across team (30%), investors (50%), and community (20%), establishing equitable stakeholder distribution. The article details inflation control through BNB's dual-layer burn mechanism: quarterly Auto-Burn adjusts based on price and network activity, while real-time gas fee burns create continuous supply reduction toward a 100 million cap. Learn how deflationary design links token destruction to long-term value capture, and how DAO governance enables token holders to influence burning parameters directly. Perfect for investors, developers, and crypto enthusiasts seeking to understand tokenomics design principles that balance fair distribution, inflation management, and sustainable value creation through verifiable, transparent mechanisms on Gate exchange.
2026-01-09 11:10:58

What is Hyperliquid (HYPE) market overview with $5.85B market cap and $225M daily trading volume
Hyperliquid (HYPE) establishes itself as a dominant force in decentralized derivatives trading with a $5.85 billion market cap ranking #32 globally and generating $225 million in daily trading volume. The platform operates on its proprietary Layer 1 blockchain, delivering zero gas fees and high-speed on-chain execution with block latency under one second. HYPE token supply shows 339.3 million circulating tokens against 961.7 million total supply, indicating strategic staged token distribution. Available across 34 major exchanges including Hyperliquid DEX, Binance, KuCoin, and Gate, the token captures 55% of decentralized derivatives market share in 2024. The token powers governance, staking rewards, and community ownership while supporting up to 50x leverage across 130+ perpetual markets. This comprehensive market overview covers HYPE's competitive positioning, tokenomics structure, robust liquidity metrics, and multi-platform accessibility for traders seeking professional-grade decentralized derivatives solu
2026-01-09 11:08:21

How to Use MACD, RSI, and Bollinger Bands to Predict Crypto Price Movements in 2026
This comprehensive guide explores how to leverage MACD, RSI, and Bollinger Bands to forecast cryptocurrency price movements effectively. Learn to identify overbought and oversold conditions using RSI and MACD signals, achieving greater accuracy by combining indicators to reduce false signals. Discover how Bollinger Bands integrated with moving average crossovers predict price reversals with approximately 70% accuracy, while volume-price divergence serves as an early warning system for major market corrections. Master the synergistic approach of multi-indicator analysis essential for 2026's volatile crypto markets. Whether you're an algorithmic trader or institutional participant on Gate, these technical frameworks provide actionable strategies for strategic positioning and defensive trading throughout the year's anticipated volatility cycles.
2026-01-09 11:06:31

How does FET compare to competitors like Wolfspeed and Infineon in market share and performance?
This article provides a comprehensive competitive analysis of FET against industry leaders Wolfspeed and Infineon in the silicon carbide semiconductor market. It examines market positioning, with Wolfspeed holding 34% global SiC substrate share and Infineon pursuing aggressive €5 billion expansion. The analysis highlights emerging domestic challengers like Xinjie Energy and Shang Dingxin demonstrating 20%-56.9% gross margins. FET's B3M platform demonstrates competitive technical advantages with 1.45 mΩ Rds(on) and superior switching loss performance, while offering cost-competitiveness through efficient manufacturing. The article addresses key performance metrics, market dynamics, and FET's strategic positioning in automotive electronics and 5G communications, providing readers with actionable insights into competitive differentiation and growth opportunities through 2028.
2026-01-09 11:03:50

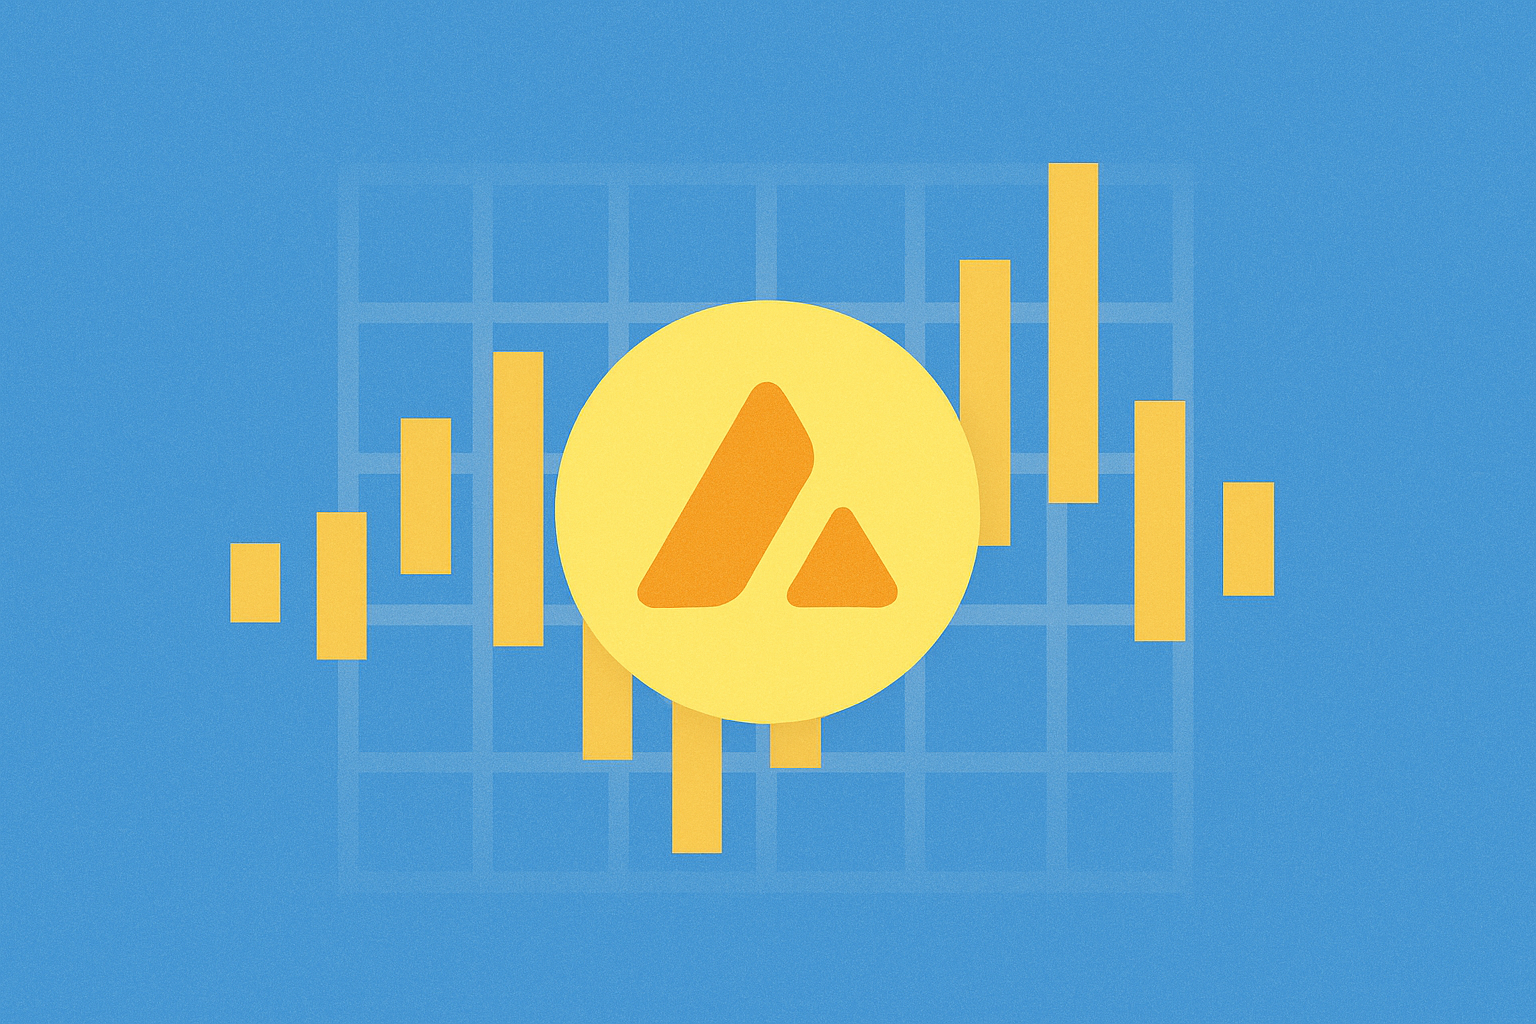
How Does Avalanche On-Chain Data Analysis Reveal Whale Movements and Transaction Trends?
This comprehensive guide reveals how on-chain data analysis on Avalanche uncovers whale movements and transaction trends. Discover how 362,000 wallets accumulating 21.65 million AVAX at $22.8 support levels indicate institutional confidence and ecosystem strength. Analyze whale behavior patterns influencing price action, explore C-Chain's 493% quarterly transaction surge and deflationary fee burn mechanisms, and examine DeFi TVL recovery reaching $1.21 billion. Learn to leverage on-chain metrics through platforms like Xangle and Bubblemaps to identify accumulation signals, monitor large transaction flows, and predict market movements. This analysis equips traders and investors with actionable insights for understanding AVAX price dynamics and network adoption across Avalanche's expanding subnet ecosystem.
2026-01-09 11:01:15
How will AVAX price volatility evolve by 2030: resistance levels, historical trends, and Bitcoin correlation analysis
This comprehensive analysis examines AVAX price volatility through 2030, tracking its evolution from $144.96 ATH in 2021 to current $14.00 trading ranges. The article identifies critical technical support at $13.50-$14.00 and resistance targets at $15.50-$16.50, providing traders actionable price levels. Current volatility metrics stand at 8.43%, with 30-day realized volatility reaching 17.83%, while Bitcoin correlation coefficient of 0.25 indicates moderate market interdependence. Using historical pattern analysis, technical indicators including MACD and RSI, plus macro-event catalysts, the content delivers predictive frameworks for AVAX's volatility evolution through 2030. Ideal for traders, investors, and cryptocurrency analysts seeking data-driven insights into layer-1 blockchain price dynamics and risk assessment strategies on Gate.
2026-01-09 10:59:34

What is the fundamental analysis of crypto projects: whitepaper logic, use cases, and team background explained
This article provides a comprehensive guide to fundamental analysis of cryptocurrency projects through three critical dimensions. First, it examines whitepaper tokenomics models and economic sustainability mechanisms, including supply dynamics and inflation rates. Second, it evaluates real-world use cases spanning DeFi to institutional finance integration, assessing whether projects address genuine market needs. Third, it analyzes development team execution capability and track records, measuring whether teams consistently deliver on technical commitments. The article further explores roadmap progress tracking and milestone achievement as accountability indicators. By examining tokenomics sustainability, practical application value, team competency, and implementation reliability on platforms like Gate, investors gain essential frameworks to distinguish viable projects from overhyped ventures and make informed crypto investment decisions.
2026-01-09 10:57:36

Chris Larsen Joins the World's 200 Richest with $15.3 Billion Fortune
Chris Larsen, co-founder of Ripple, has achieved a net worth of $15.3 billion, securing a position among the world's 200 wealthiest individuals. His wealth derives from an 18% equity stake in Ripple and approximately 2.7 billion XRP tokens valued at $6.3 billion. The milestone reflects the maturation of blockchain technology and its increasing institutional adoption. A pivotal regulatory victory in August 2024 resolved legal uncertainties and accelerated market confidence. In October 2025, a strategic investment round valued Ripple at $40 billion, further strengthening Larsen's financial position. His success demonstrates how blockchain pioneers combining technological innovation with strategic business development can create extraordinary wealth through transformative digital payment infrastructure.
2026-01-09 10:57:18

What is tokenomics: a complete guide to token distribution, inflation mechanisms, and governance rights in 2026
This comprehensive guide explores tokenomics fundamentals through three critical pillars: token distribution frameworks balancing team, investor, and community allocation; inflation and deflation mechanisms including burn protocols and buybacks used by leading protocols; and governance rights driving enterprise adoption. By 2026, standardized allocation models (approximately 40% team, 20% investors, 40% community) enable transparent benchmarking across projects on Gate and other platforms. The guide reveals how thoughtful tokenomics design—combining transparent vesting schedules, deflationary mechanisms, and meaningful governance participation—creates sustainable ecosystems that attract institutional adoption. Whether assessing supply dynamics or evaluating governance structures, this resource equips stakeholders with essential knowledge to identify healthy tokenomics models and understand how token economics directly correlate with long-term project viability and genuine utility creation.
2026-01-09 10:55:52

Indicators point to a strong Bitcoin recovery in 2026
PeterBot Beginner’s Guide. This guide clearly explains the fundamentals of operating automated trading bots and investment strategies, from valuing Bitcoin with Metcalfe’s Law to projecting market trends for 2026. It also presents efficient risk management methods through Gate integration.
2026-01-09 10:55:31

Flying Tulip, led by Andre Cronje, secured $200 million in a seed funding round
Flying Tulip secured $200 million in seed funding led by André Cronje. The DeFi platform introduces a unique on-chain buyback mechanism. Key investors are Brevan Howard Digital, DWF Labs, and CoinFund. The FDV stands at $1 billion. Discover more about this groundbreaking Web3 platform.
2026-01-09 10:53:51

How Does MON Community Activity Compare With 150% Growth in Active Addresses and $400M Daily Trading Volume?
This article examines MON's explosive community growth through key performance metrics, specifically the 150% surge in active addresses and $400M daily trading volume since mainnet launch. The analysis reveals how MON's technical architecture—delivering 10,000 transactions per second with sub-500ms finality—directly enables high-volume trading and sustainable ecosystem adoption. The article explores the correlation between blockchain infrastructure performance and market behavior, demonstrating how reduced transaction costs and minimal latency remove participation barriers for both retail and institutional users. Additionally, whale accumulation of 37M tokens signals institutional confidence in MON's developer-focused infrastructure. The comprehensive FAQ section addresses investor concerns about community activity metrics, growth drivers, and competitive positioning. These combined indicators—strong network utilization, institutional participation, and technical reliability—suggest MON is establishing itself
2026-01-09 10:53:42
Why Bitcoin Fell Below $90,000: ETF Outflows and Crypto Liquidations Explained
This article explains Bitcoin's sharp decline below the $90,000 psychological barrier on January 8th, 2026, driven by a $486 million ETF outflow—the largest single-day redemption since November. The exodus triggered a cascade of liquidations exceeding $128 million as leveraged traders faced automatic margin calls, amplified by thin liquidity conditions. The breakdown through the critical $90,000 support level revealed how institutional redemptions now function as primary price drivers in modern crypto markets. Dealer hedging strategies and macroeconomic uncertainty from central bank policy ambiguity have compressed Bitcoin into a tight $90,000-$95,000 range, creating both technical constraints and liquidation risks. Understanding the connection between ETF outflows and crypto liquidations has become essential for traders navigating institutional-driven price discovery mechanisms.
2026-01-09 10:52:45

Euro Stablecoins Poised to Challenge the Dollar in Tokenized Finance
Explore the rise of euro stablecoins in tokenized finance. See how euro stablecoins are challenging the dominance of the dollar, their growth prospects in Web3, and their influence on decentralized finance. Gain insight into regulations, emerging opportunities, and the future of euro-backed digital assets.
2026-01-09 10:52:27

How to use MACD, RSI, and Bollinger Bands to analyze crypto price trends
This comprehensive guide teaches traders how to leverage MACD, RSI, and Bollinger Bands to analyze crypto price trends effectively. The article explores how MACD identifies momentum shifts, RSI gauges overbought/oversold conditions, and Bollinger Bands contextualize volatility patterns. It covers advanced concepts including golden cross and dead cross signals, volume-price divergence for detecting false breakouts, and a multi-indicator confirmation strategy that reduces false signals by 40%. By combining these three core indicators across multiple dimensions, traders can distinguish genuine crypto price trends from market noise, improve entry/exit timing on Gate exchange, and significantly enhance trading accuracy on daily timeframes with systematic confirmation criteria.
2026-01-09 10:51:46

Your Gateway to Crypto World, Subscribe to Gate for a New Perspective