

ALuyao
Fate is indescribable; your connection with me depends on whether you can find me.
ALuyao
The market is currently in a state of panic, especially yesterday. At this time, following the herd to be bearish is meaningless. I've never seen retail investors able to accurately guess the direction and make money when the entire market is in panic; they are basically missing out, too afraid to buy or shorting.
It was very similar to now back in April. The current price has broken below the bull-bear demarcation line, which technically indicates that it should be a bear market. However, that doesn't necessarily mean it is a bear market right now. It is very likely that we are in the
View OriginalIt was very similar to now back in April. The current price has broken below the bull-bear demarcation line, which technically indicates that it should be a bear market. However, that doesn't necessarily mean it is a bear market right now. It is very likely that we are in the
- Reward
- like
- Comment
- Repost
- Share
The more you say, the more it is. The real market is always being monitored in real time.
#Gate 新上线 WLFI# #九月份加密市场能否突破# #今日你看涨还是看跌?#
4280 on the first line, reached a high of 4330, with a 50-point range.
View Original#Gate 新上线 WLFI# #九月份加密市场能否突破# #今日你看涨还是看跌?#
4280 on the first line, reached a high of 4330, with a 50-point range.
- Reward
- like
- Comment
- Repost
- Share
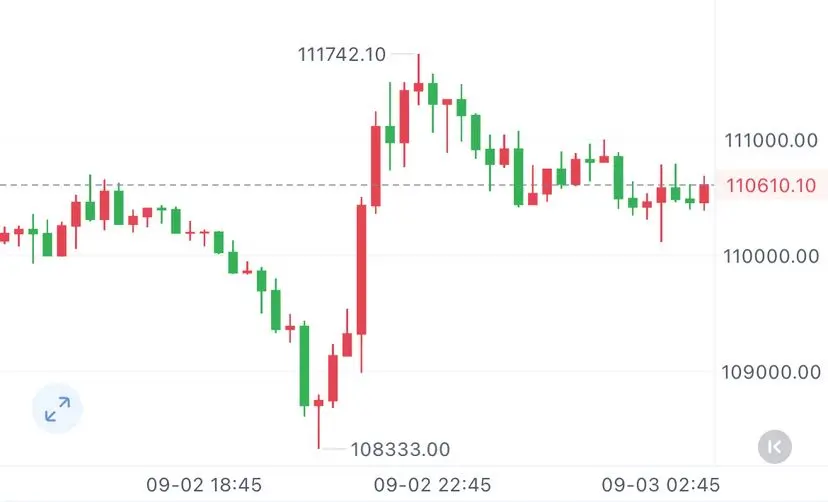
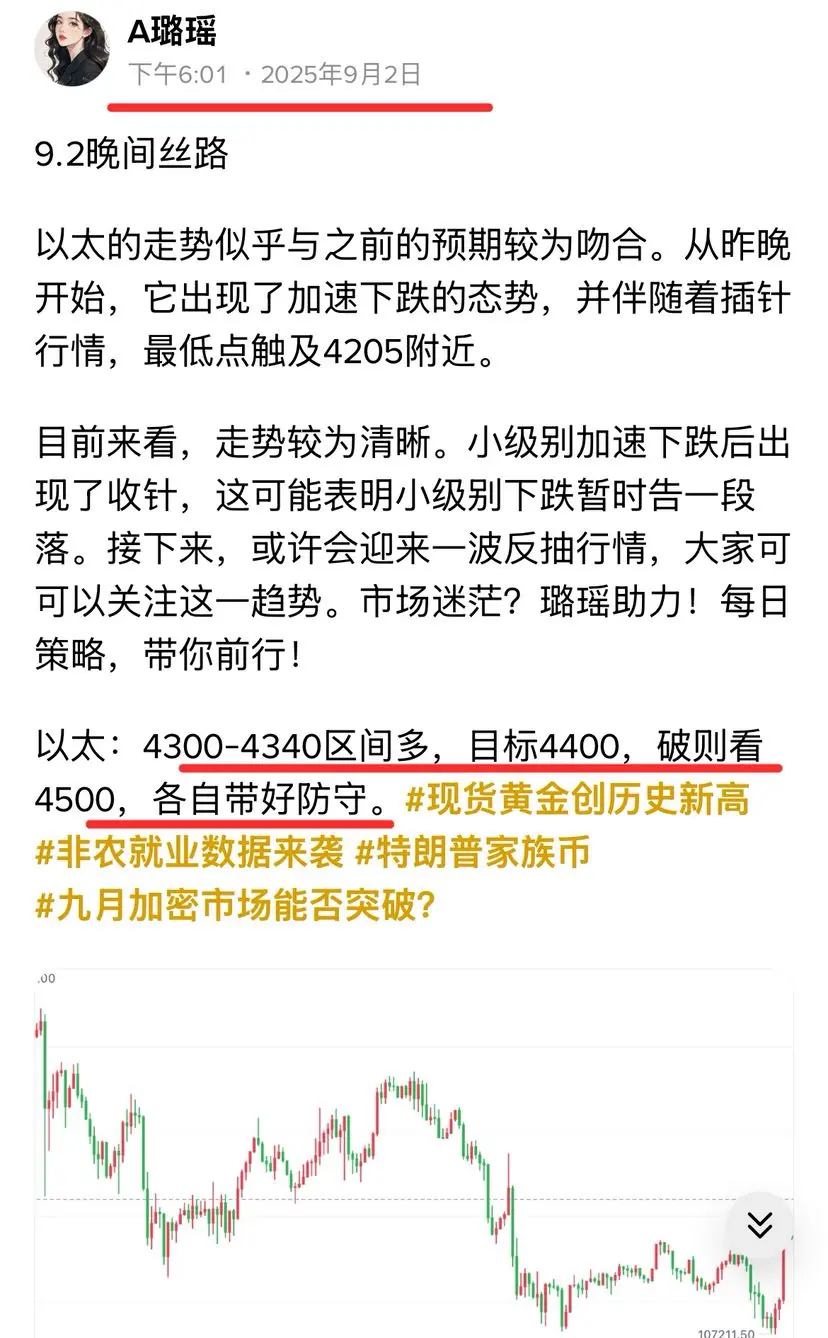
Silk Road on the evening of 9.2
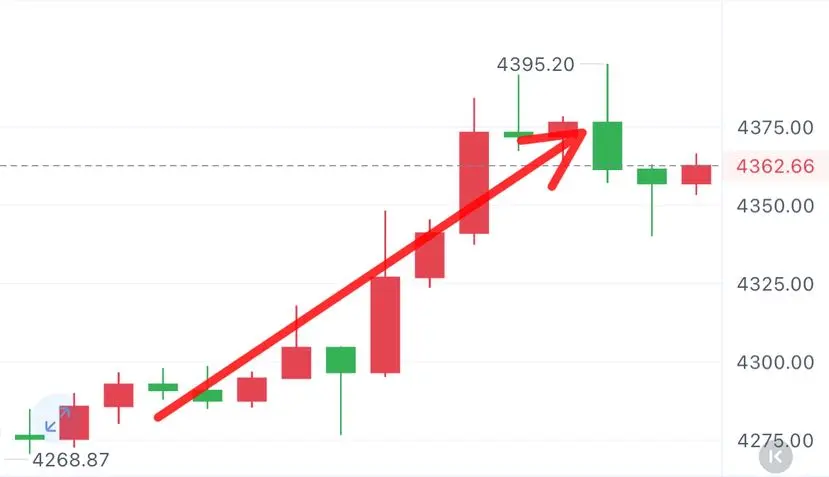
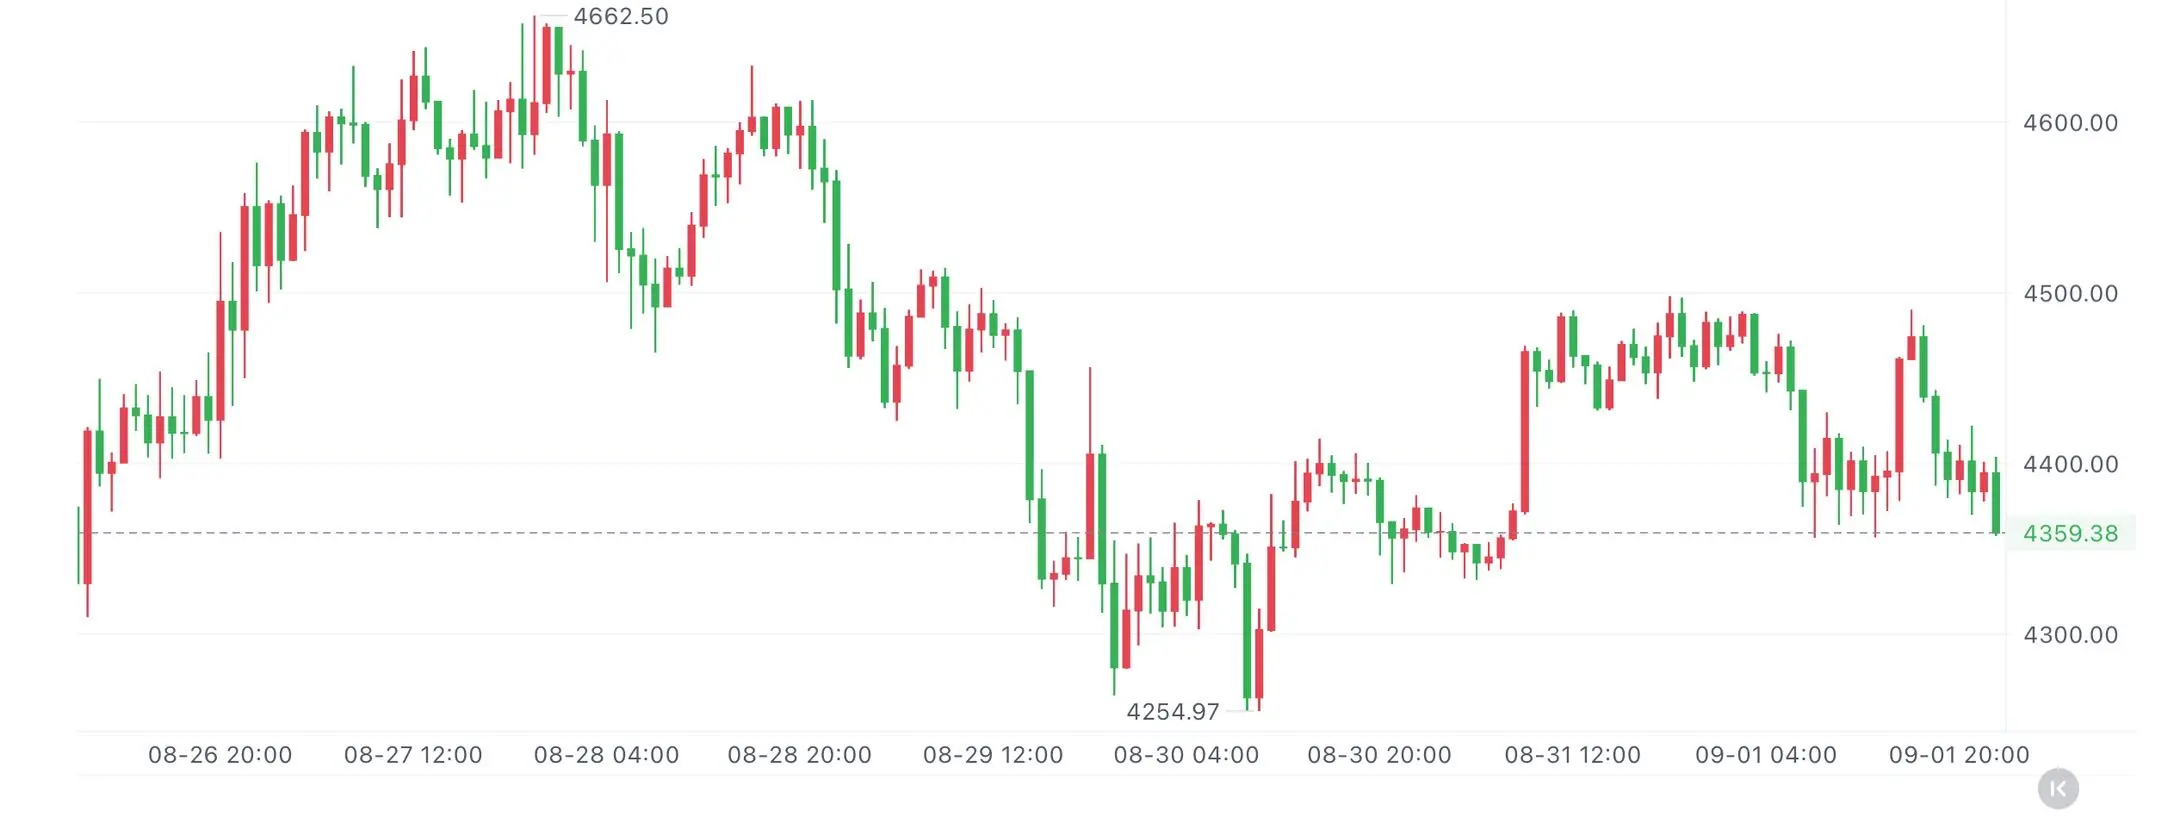
The trend of Ethereum seems to align more with previous expectations. Since last night, it has shown a trend of accelerated decline, accompanied by a spike in price, with the lowest point reaching around 4205.
At present, the trend is relatively clear. After a rapid decline in the small time frame, a spinning top has appeared, which may indicate a temporary pause in the small downward trend. Next, there may be a wave of a rebound, so everyone can pay attention to this trend. Is the market confusing? Luyao is here to help! Daily strategies to guide you forward!
E
View OriginalThe trend of Ethereum seems to align more with previous expectations. Since last night, it has shown a trend of accelerated decline, accompanied by a spike in price, with the lowest point reaching around 4205.
At present, the trend is relatively clear. After a rapid decline in the small time frame, a spinning top has appeared, which may indicate a temporary pause in the small downward trend. Next, there may be a wave of a rebound, so everyone can pay attention to this trend. Is the market confusing? Luyao is here to help! Daily strategies to guide you forward!
E
- Reward
- like
- Comment
- Repost
- Share
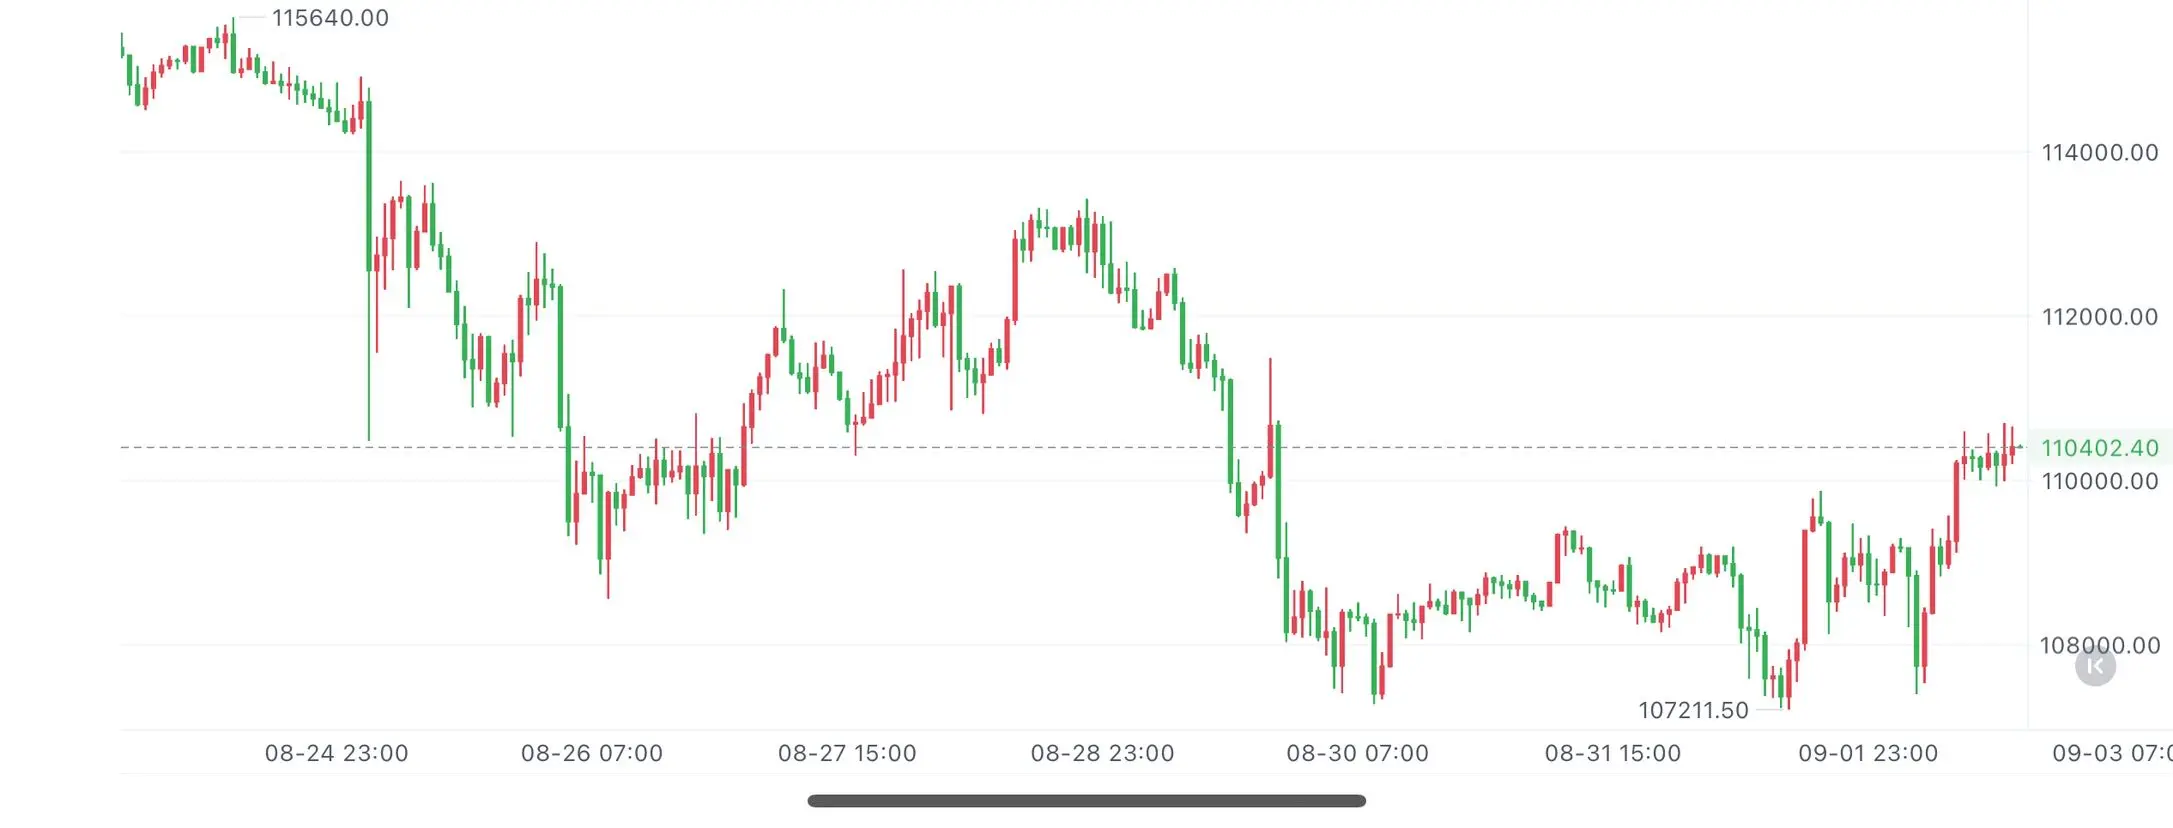
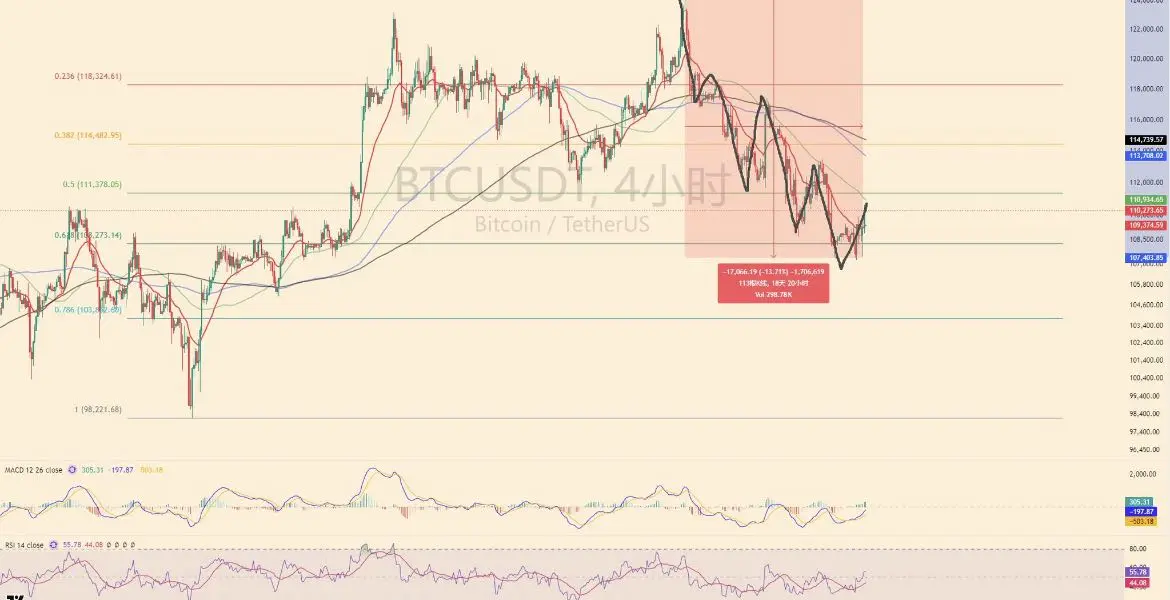
Why has BTC been oscillating and falling on the 4-hour chart? It falls and then bounces, then falls again? To put it simply in one sentence:
Bitcoin is now gradually breaking the upward trend and gradually confirming the fall.
The fluctuations, the sawtooth pattern, and the confirmation on the way back all indicate that the current fall is still very restrained and rational, which also means that panic emotions have not yet emerged. #ETH# #GateioInto11#
View OriginalBitcoin is now gradually breaking the upward trend and gradually confirming the fall.
The fluctuations, the sawtooth pattern, and the confirmation on the way back all indicate that the current fall is still very restrained and rational, which also means that panic emotions have not yet emerged. #ETH# #GateioInto11#
- Reward
- like
- Comment
- Repost
- Share
Why has BTC been oscillating and falling on the 4-hour chart? It falls and then bounces, then falls again? To put it simply in one sentence:
Bitcoin is now gradually breaking the upward trend and gradually confirming the fall.
Consolidation, zigzag, and confirming the pullback all indicate that the current fall is still very restrained and rational, which also means that there is no panic sentiment yet. #BTC#
View OriginalBitcoin is now gradually breaking the upward trend and gradually confirming the fall.
Consolidation, zigzag, and confirming the pullback all indicate that the current fall is still very restrained and rational, which also means that there is no panic sentiment yet. #BTC#

- Reward
- like
- Comment
- Repost
- Share
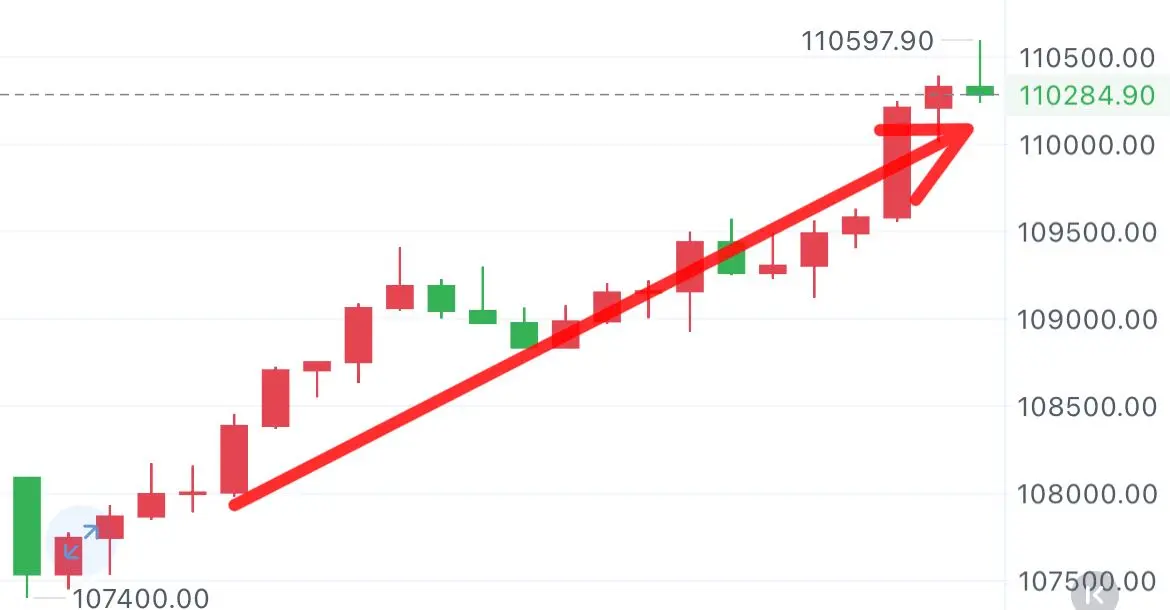
If the bottom doesn’t break, there’s no need to hesitate, just go long.
107400 on-line more, peaked at 110500, 3100 typical #Gate 新上线 WLFI# #九月份加密市场能否突破# #今日你看涨还是看跌?# #BTC#
View Original107400 on-line more, peaked at 110500, 3100 typical #Gate 新上线 WLFI# #九月份加密市场能否突破# #今日你看涨还是看跌?# #BTC#
- Reward
- like
- 1
- Repost
- Share
Firecracker1 :
:
How to copy tradingThe intraday fluctuation is not large, but Luyao manages to seize every wave well.
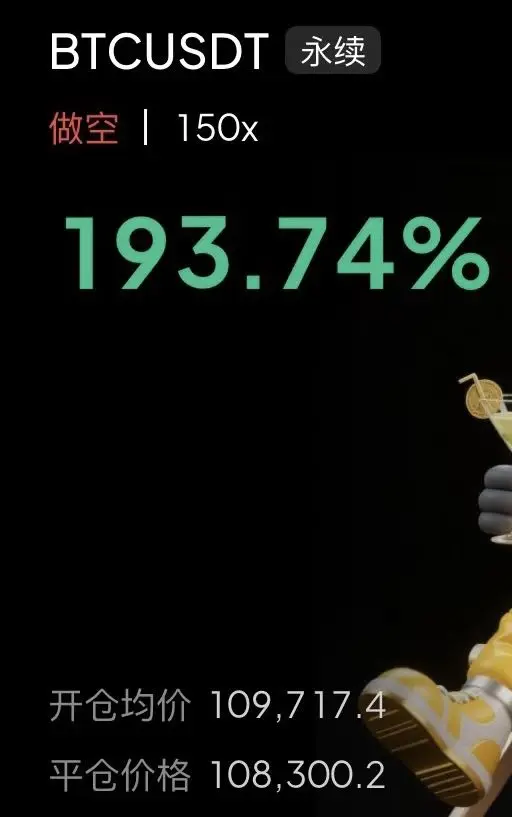
109700 short at the first line, exit at 108300, 1400 points space #Gate 新上线 WLFI# #九月份加密市场能否突破# #今日你看涨还是看跌?#
View Original109700 short at the first line, exit at 108300, 1400 points space #Gate 新上线 WLFI# #九月份加密市场能否突破# #今日你看涨还是看跌?#

- Reward
- like
- Comment
- Repost
- Share
BTC 107300 long at one line, exit at 109400, 2100 typical, 24000 drop at #Gate 新上线 WLFI# #九月份加密市场能否突破# #今日你看涨还是看跌?#
View Original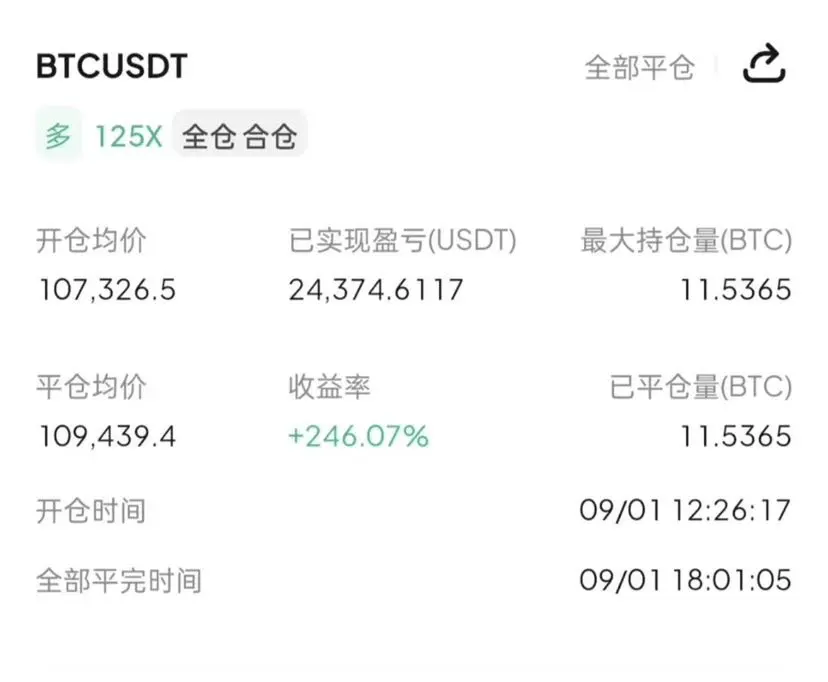
- Reward
- 1
- Comment
- Repost
- Share
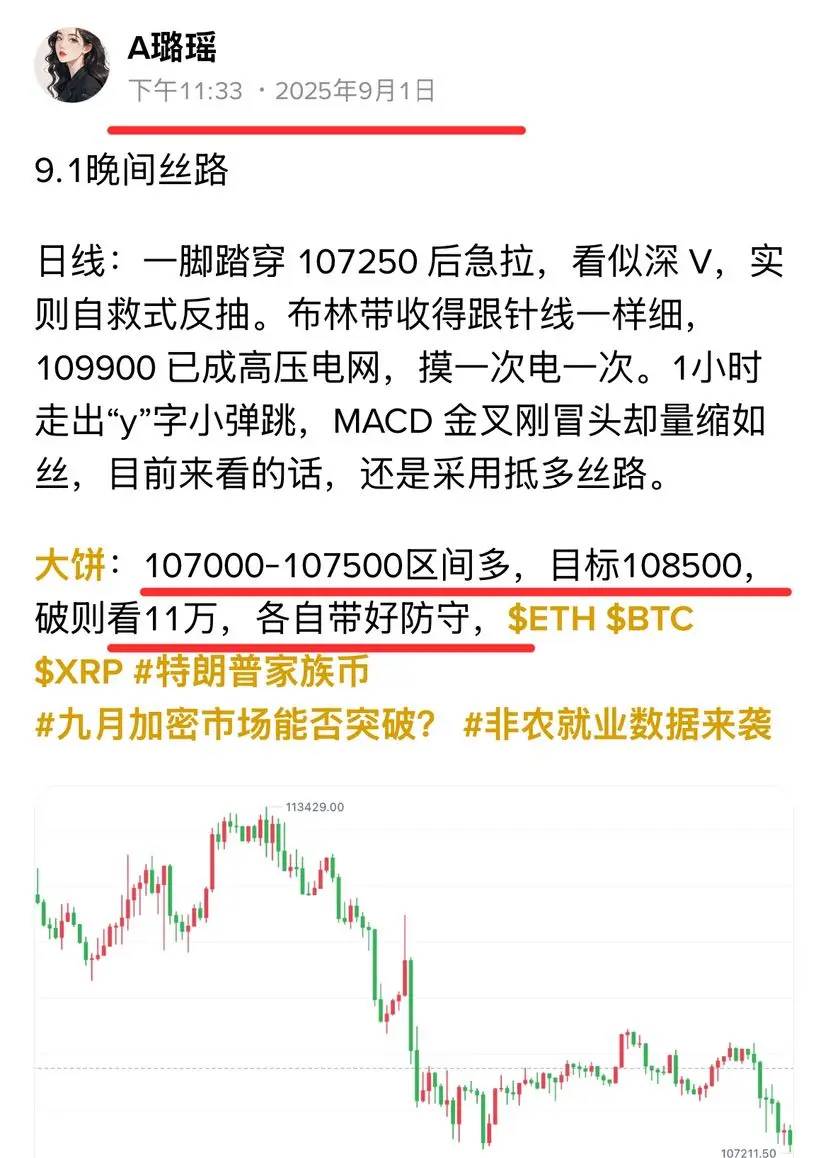
Silk Road on the evening of 9.1
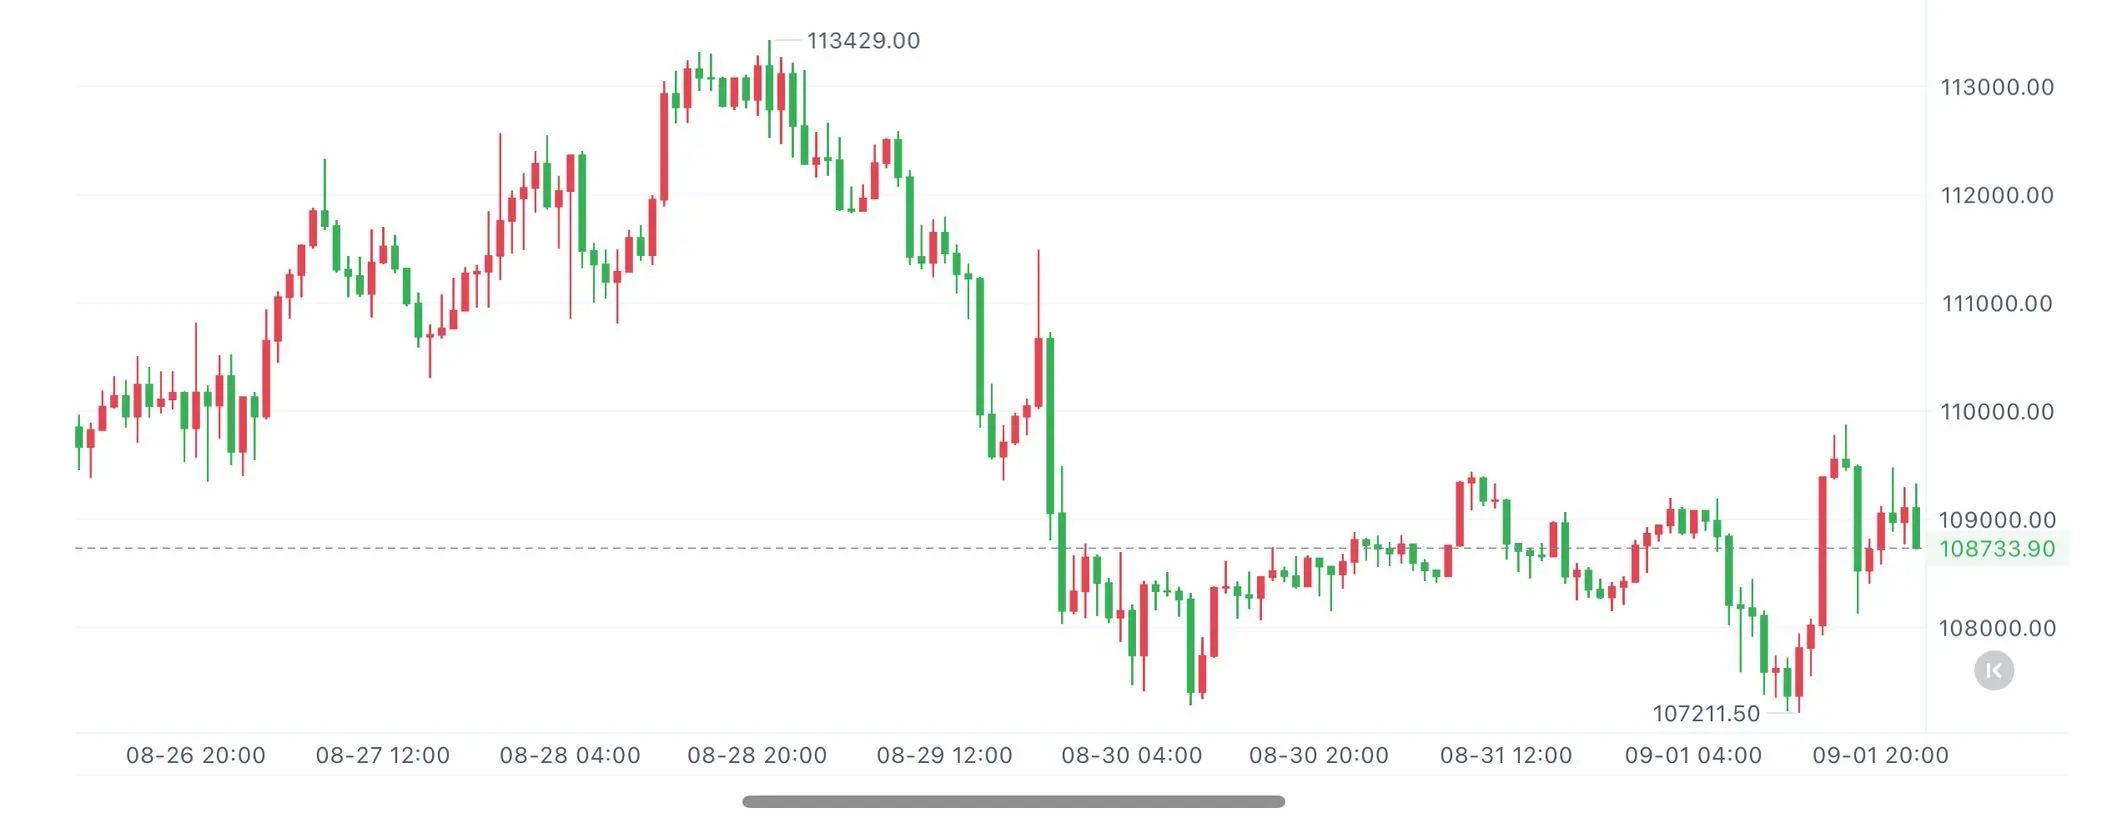
Daily: After breaking through 107250, there was a quick rally, appearing to be a deep V, but in fact, it was a self-rescue type of rebound. The Bollinger Bands have narrowed down to a thread-like width, with 109900 becoming a high-pressure electric net, touching it once results in being shocked once. The 1-hour chart has shown a small "y" shaped bounce, the MACD golden cross has just emerged but the volume has shrunk to a thread, currently, it still adopts a resistance to the upward trend.
BTC: Long in the range of 107000-107500, target 108500, if it breaks then
View OriginalDaily: After breaking through 107250, there was a quick rally, appearing to be a deep V, but in fact, it was a self-rescue type of rebound. The Bollinger Bands have narrowed down to a thread-like width, with 109900 becoming a high-pressure electric net, touching it once results in being shocked once. The 1-hour chart has shown a small "y" shaped bounce, the MACD golden cross has just emerged but the volume has shrunk to a thread, currently, it still adopts a resistance to the upward trend.
BTC: Long in the range of 107000-107500, target 108500, if it breaks then
- Reward
- 1
- Comment
- Repost
- Share