Futures
Access hundreds of perpetual contracts
TradFi
Gold
One platform for global traditional assets
Options
Hot
Trade European-style vanilla options
Unified Account
Maximize your capital efficiency
Demo Trading
Introduction to Futures Trading
Learn the basics of futures trading
Futures Events
Join events to earn rewards
Demo Trading
Use virtual funds to practice risk-free trading
Launch
CandyDrop
Collect candies to earn airdrops
Launchpool
Quick staking, earn potential new tokens
HODLer Airdrop
Hold GT and get massive airdrops for free
Launchpad
Be early to the next big token project
Alpha Points
Trade on-chain assets and earn airdrops
Futures Points
Earn futures points and claim airdrop rewards
More
Zhang Yao Xi: High Oil Prices Haunted by Inflation Pressure, Gold Prices Under Pressure Awaiting Bottom Rebound
Zhang Yaoxi: High Oil Prices Continue to Drive Inflation Pressure, Gold Prices Remain Under Pressure and Still Await a Bottom Rebound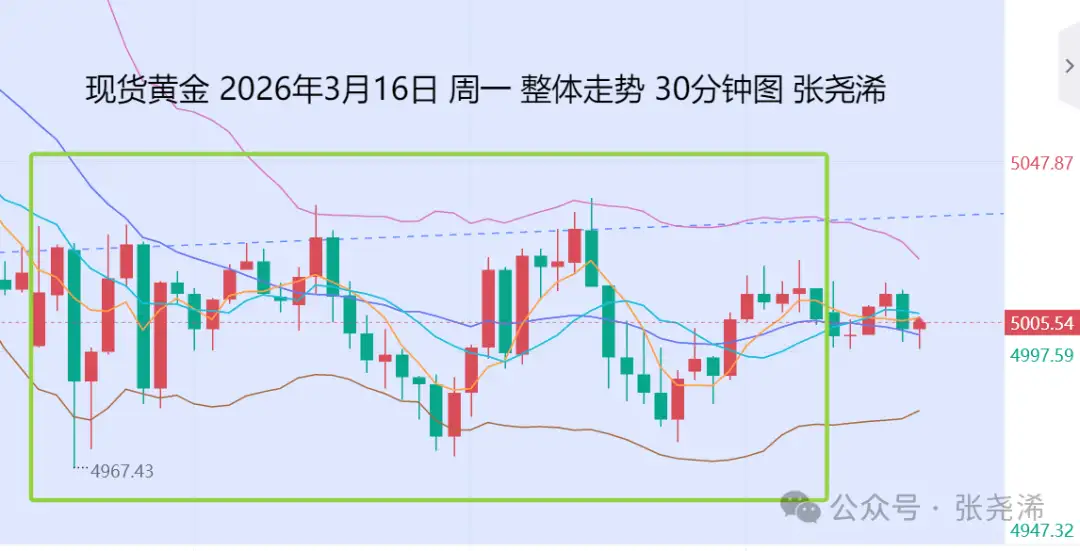
On the last trading day, Monday (March 16): International gold prices oscillated in a doji pattern, signaling a pause in the decline and a potential bullish trend. Additionally, Trump and U.S. Treasury Secretary Yellen appeared to soothe the market. Crude oil opened high but declined throughout the day, accelerating before the U.S. session, which eased inflation concerns and caused the U.S. dollar index to fall sharply, limiting gold price declines. In the short term, gold prices are expected to remain volatile or rebound, but a larger rally requires prices to stay above the middle band; otherwise, there is still a risk of decline and demand weakness.
In terms of specific movement, gold opened in Asia at $4,999.11 per ounce and continued to fluctuate around the $5,000 level, repeatedly approaching the intraday low of $4,967.86 and the intraday high of $5,037.44 recorded early in the U.S. session. It ultimately closed at $5,006.27, with a daily range of $69.58. Compared to last week’s close of $5,024.58, it fell by $18.31, a 0.36% decrease.
Looking ahead to Tuesday (March 17): International gold opened with slight strength and narrow fluctuations. Early in the session, the U.S. dollar index and crude oil stabilized, exerting some pressure on gold prices;
However, both the dollar index and crude oil yesterday formed a bearish engulfing pattern, indicating a potential top and bearish outlook. This suggests that even if prices decline again, they are likely to remain within a rebound high zone, limiting gold’s downside and maintaining its oscillation.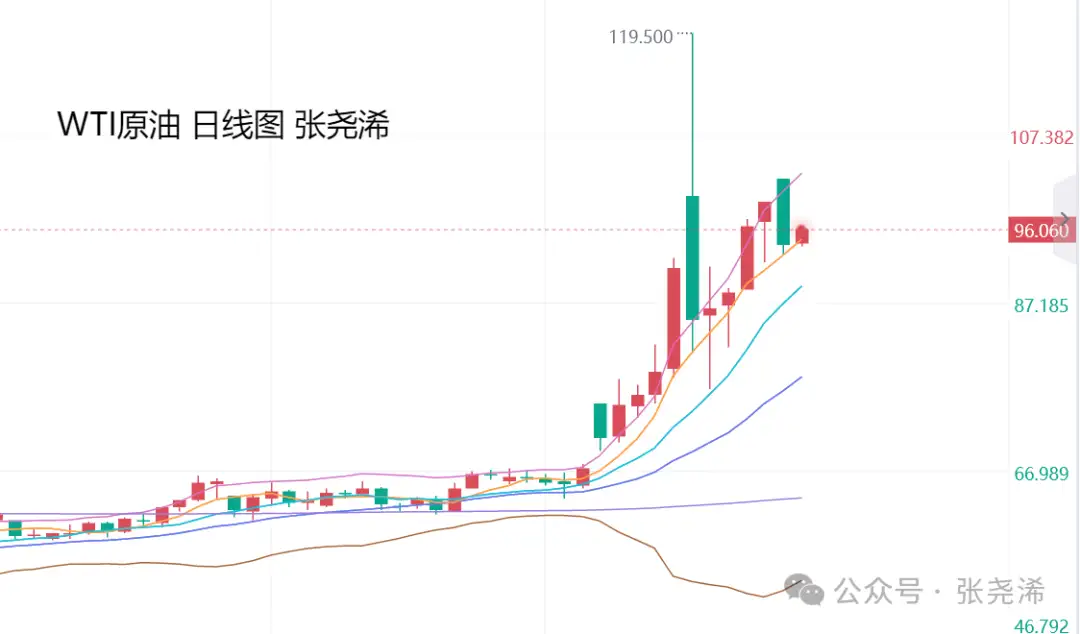
Furthermore, Trump stated that once the Iran conflict ends, oil prices could drop sharply like falling rocks. The U.S. Treasury Secretary said there has been no intervention in the oil futures market, and oil prices could be “well below” $80 within a few months. Based on these factors, oil prices are expected to fluctuate or decline in the near term.
Additionally, Trump also said the Federal Reserve should hold an emergency meeting to cut interest rates. The U.S. government is also experiencing a partial shutdown, which are negative factors for the dollar. Therefore, the dollar index is likely to decline or oscillate, which could lead to either consolidation or a rebound in gold prices.
Overall, the outlook suggests that gold prices will mainly oscillate around a bottom or rebound in the near future.
Today, attention should be paid to U.S. February existing home sales and the Conference Board’s leading economic indicators for February, as market expectations are bearish for gold, and short-term declines should be monitored.
Fundamentally, although recent oil price increases have heightened global inflation concerns, prompting central banks worldwide to adopt more cautious monetary policies, this could hinder the Federal Reserve’s ability to ease monetary policy. This, in turn, raises bond yields and short-term limits on gold’s upside.
However, if energy prices remain high at $125–$150 per barrel for an extended period, it will pressure consumer spending and could trigger a recession in the U.S., forcing rate cuts to stimulate the economy.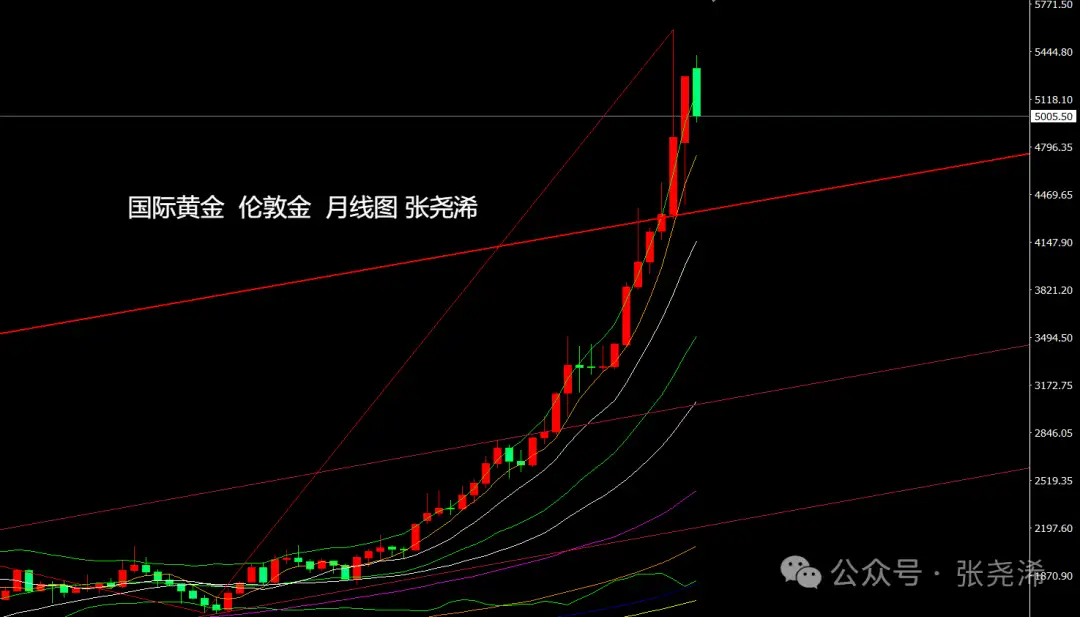
Looking back at 2020–2022, oil prices surged from zero to $129.4 per barrel, U.S. inflation rose from 1.23% to 8%, and the Fed raised interest rates seven times sharply. During this period, gold mostly oscillated around $400, then gradually rebounded.
Similarly, from July 2007 to August 2008, international oil prices doubled from $70 to $140 per barrel amid the subprime mortgage crisis, and gold, after a correction, continued its bull run.
Thus, inflation driven by oil prices and pressure on gold are only temporary. After short-term adjustments, gold is poised for a new rally.
Technically, on the monthly chart, gold has shown weakness this month but remains above the 5-month moving average and the upward trendline broken in January, indicating a still-positive bullish outlook. If prices continue to fall this month, support levels are at the May (4800) and October (4400) moving averages, which could serve as key support points for a new bull phase.
Conversely, if prices break below the trendline support and close below 4300, it would signal the end of the bull market, with potential declines to $3,500 or even lower, approaching the $3,000 level.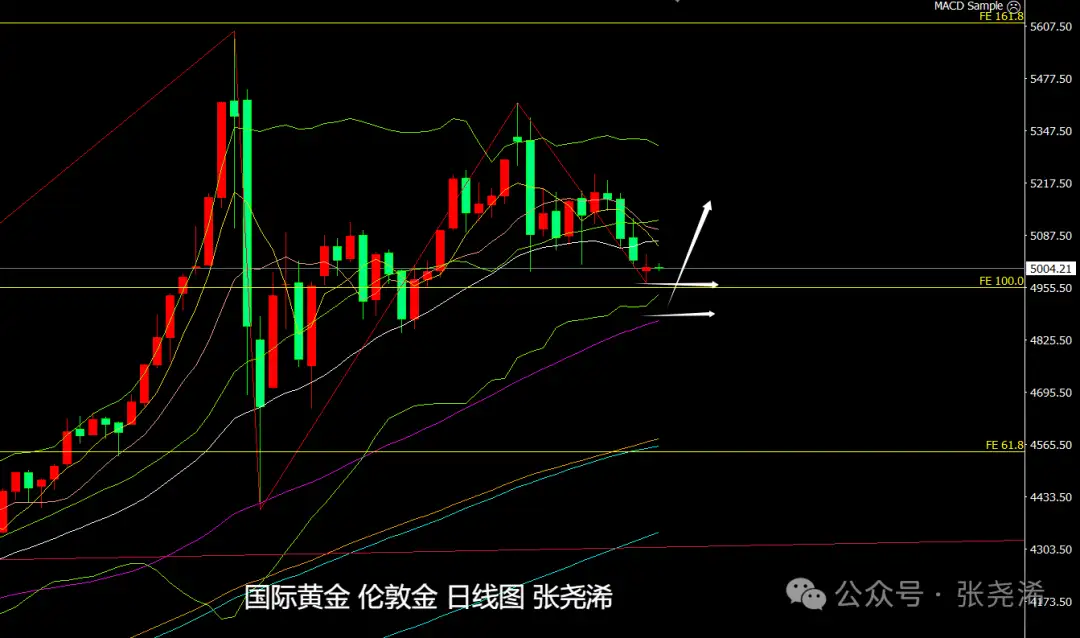
On the daily chart, gold formed a doji pattern indicating a pause in the decline with a potential bullish reversal, and the ZZ indicator also shows a bottoming after a pullback. However, prices are still below the middle band and other moving averages, with technical indicators remaining bearish. Short-term risks of further decline persist, with support at the 60-day moving average. A strong rebound above $5,200 is needed to strengthen bullish momentum.
Gold: support at $4,980 or $4,955; resistance at $5,035 or $5,060;
Silver: support at $78.45 or $77.10; resistance at $82.00 or $83.40;
Note:
Gold TD = (International gold price × exchange rate) / 31.1035
A $1 fluctuation in international gold prices roughly causes a $0.25 change in Gold TD (theoretical).
U.S. futures gold price = London spot price × (1 + gold swap rate × days to expiry / 365)
Follow me to make your gold trading ideas clearer!
Reviewing historical cause and effect, interpreting current environments, and forecasting future trends—adhering to bold predictions and cautious trading principles. – Zhang Yaoxi
The above opinions and analysis are solely the author’s personal views, for reference only, not trading advice. Operate at your own risk.
You decide your own money.