

Live stream tonight. Come, come, come.
View OriginalTrade
Trading Type
Spot
Trade crypto freely
Alpha
Points
Get promising tokens in streamlined on-chain trading
Pre-Market
Trade new tokens before they are officially listed
Margin
Magnify your profit with leverage
Convert & Block Trading
0 Fees
Trade any size with no fees and no slippage
Leveraged Tokens
Get exposure to leveraged positions simply
Futures
Futures
Hundreds of contracts settled in USDT or BTC
Options
HOT
Trade European-style vanilla options
Unified Account
Maximize your capital efficiency
Demo Trading
Futures Kickoff
Get prepared for your futures trading
Futures Events
Participate in events to win generous rewards
Demo Trading
Use virtual funds to experience risk-free trading
Earn
Launch
Investment
Simple Earn
VIP
Earn interests with idle tokens
Auto-Invest
Auto-invest on a regular basis
Dual Investment
Buy low and sell high to take profits from price fluctuations
Quant Fund
VIP
Top asset management team helps you profit without hassle
Crypto Loan
0 Fees
Pledge one crypto to borrow another
Lending Center
One-Stop Lending Hub
VIP Wealth Hub
New
Customized wealth management empowers your assets growth
Staking
Stake cryptos to earn in PoS products
BTC Staking
HOT
Stake BTC and earn 10% APR
ETH Staking
HOT
Stake ETH and earn 6% APR
GUSD Minting
New
Use USDT/USDC to mint GUSD for treasury-level yields
Soft Staking
Earn rewards with flexible staking
More
WyckoffShort-termAnalysis1
Eight years as a trader, involved in the futures forex market, focusing on intraday short-term opportunities. 1. Accurate price point releases, 2. Price point logic explanations, 3. Stable daily profits. Ensuring monthly profits of 60% and above.
Time: Daily from 8:00 to 11:30, 14:30 to 17:00, subscription live stream from 20:00 to 23:00.
WyckoffShort-termAnalysis1
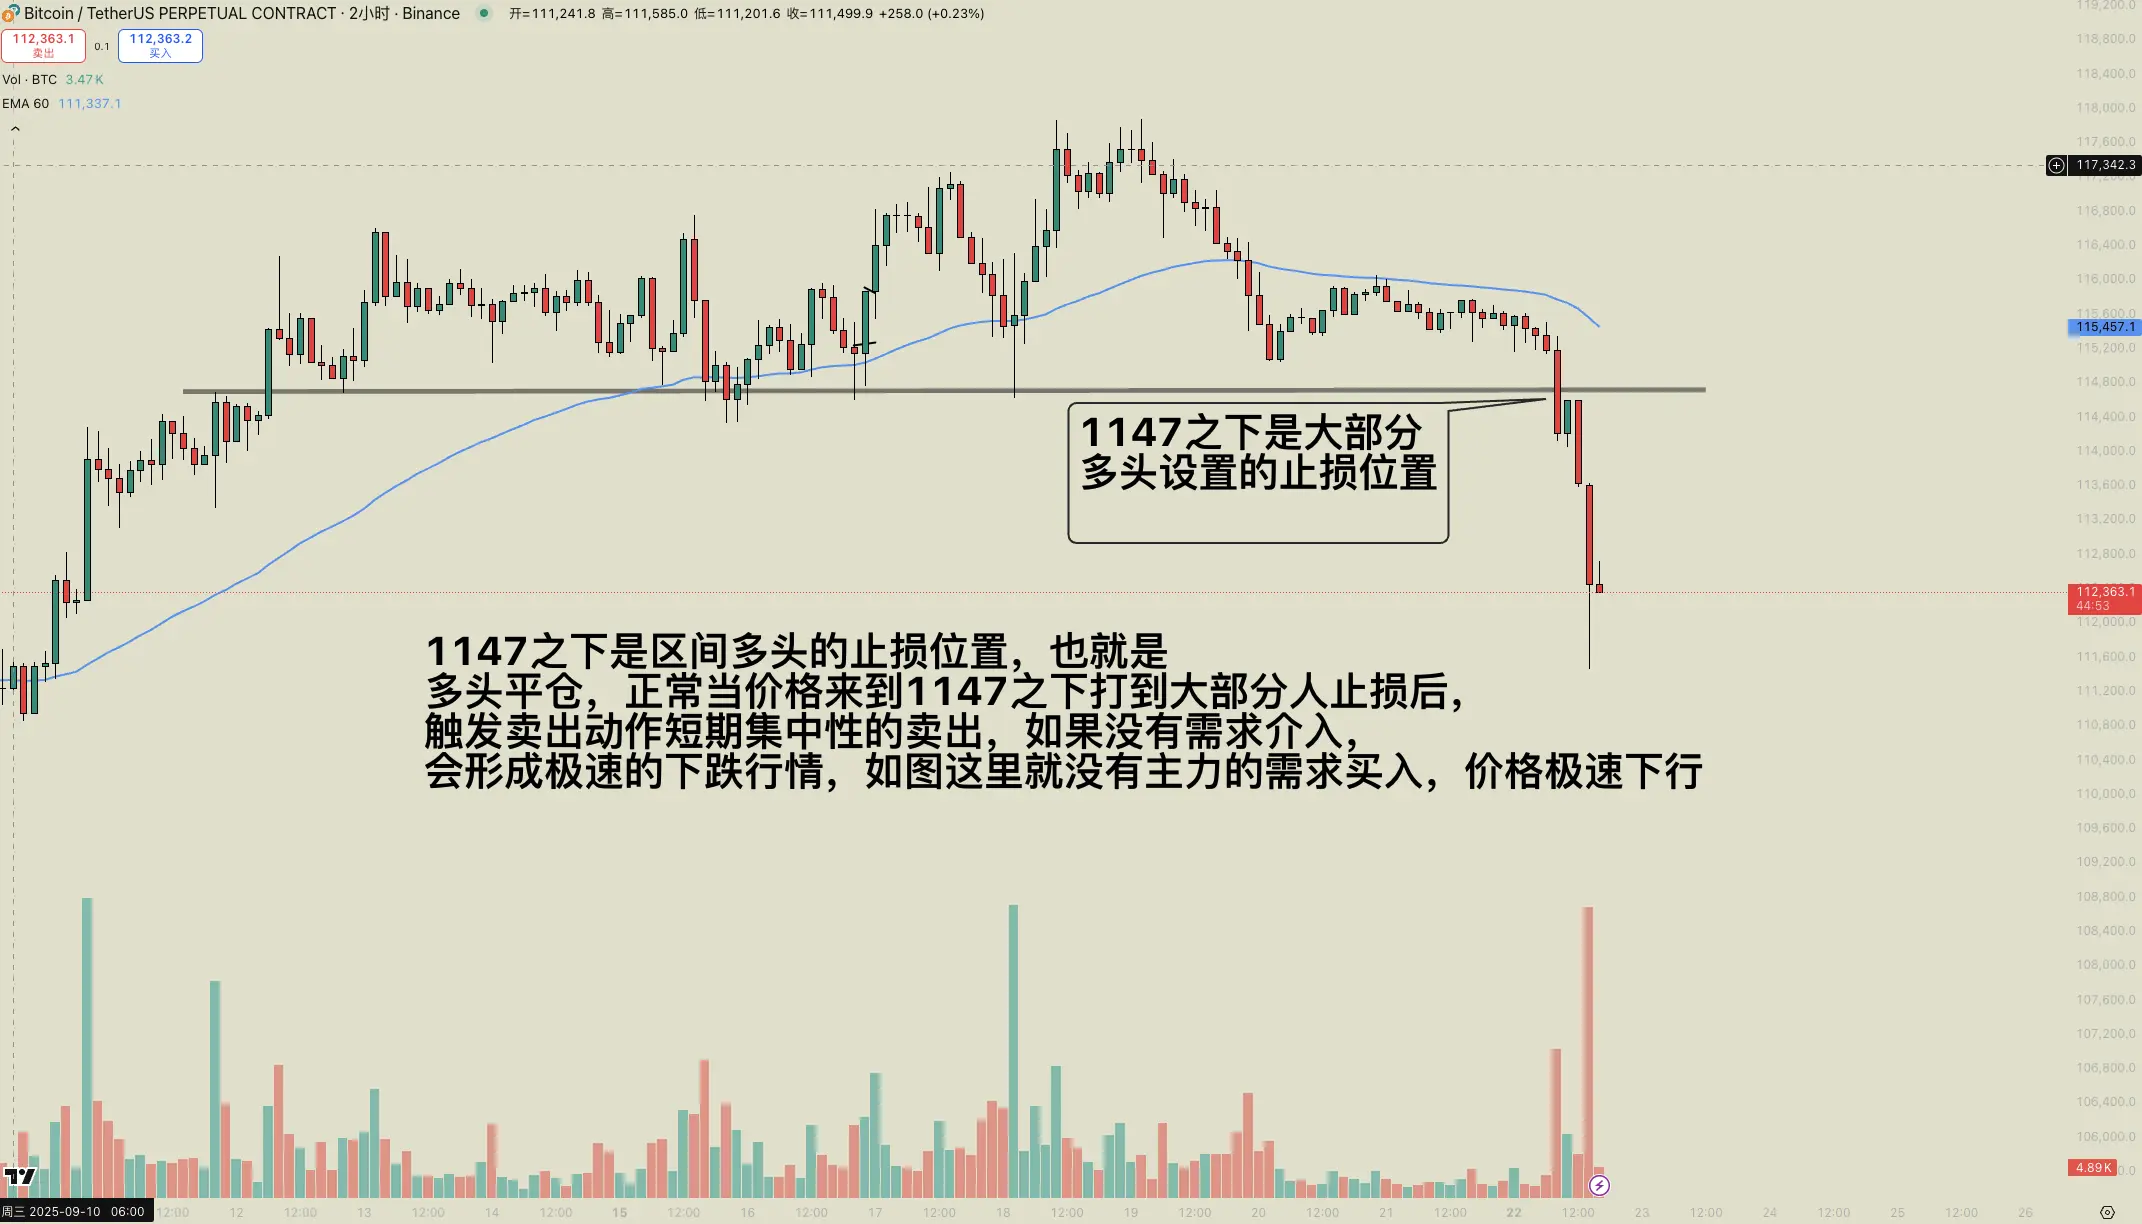
#BTC# Continuing to talk about volume and price, and sharing knowledge, this afternoon a fren asked how to see if the market maker is still present? Below we will analyze based on the market data, but before the analysis, we need to understand a few knowledge points:
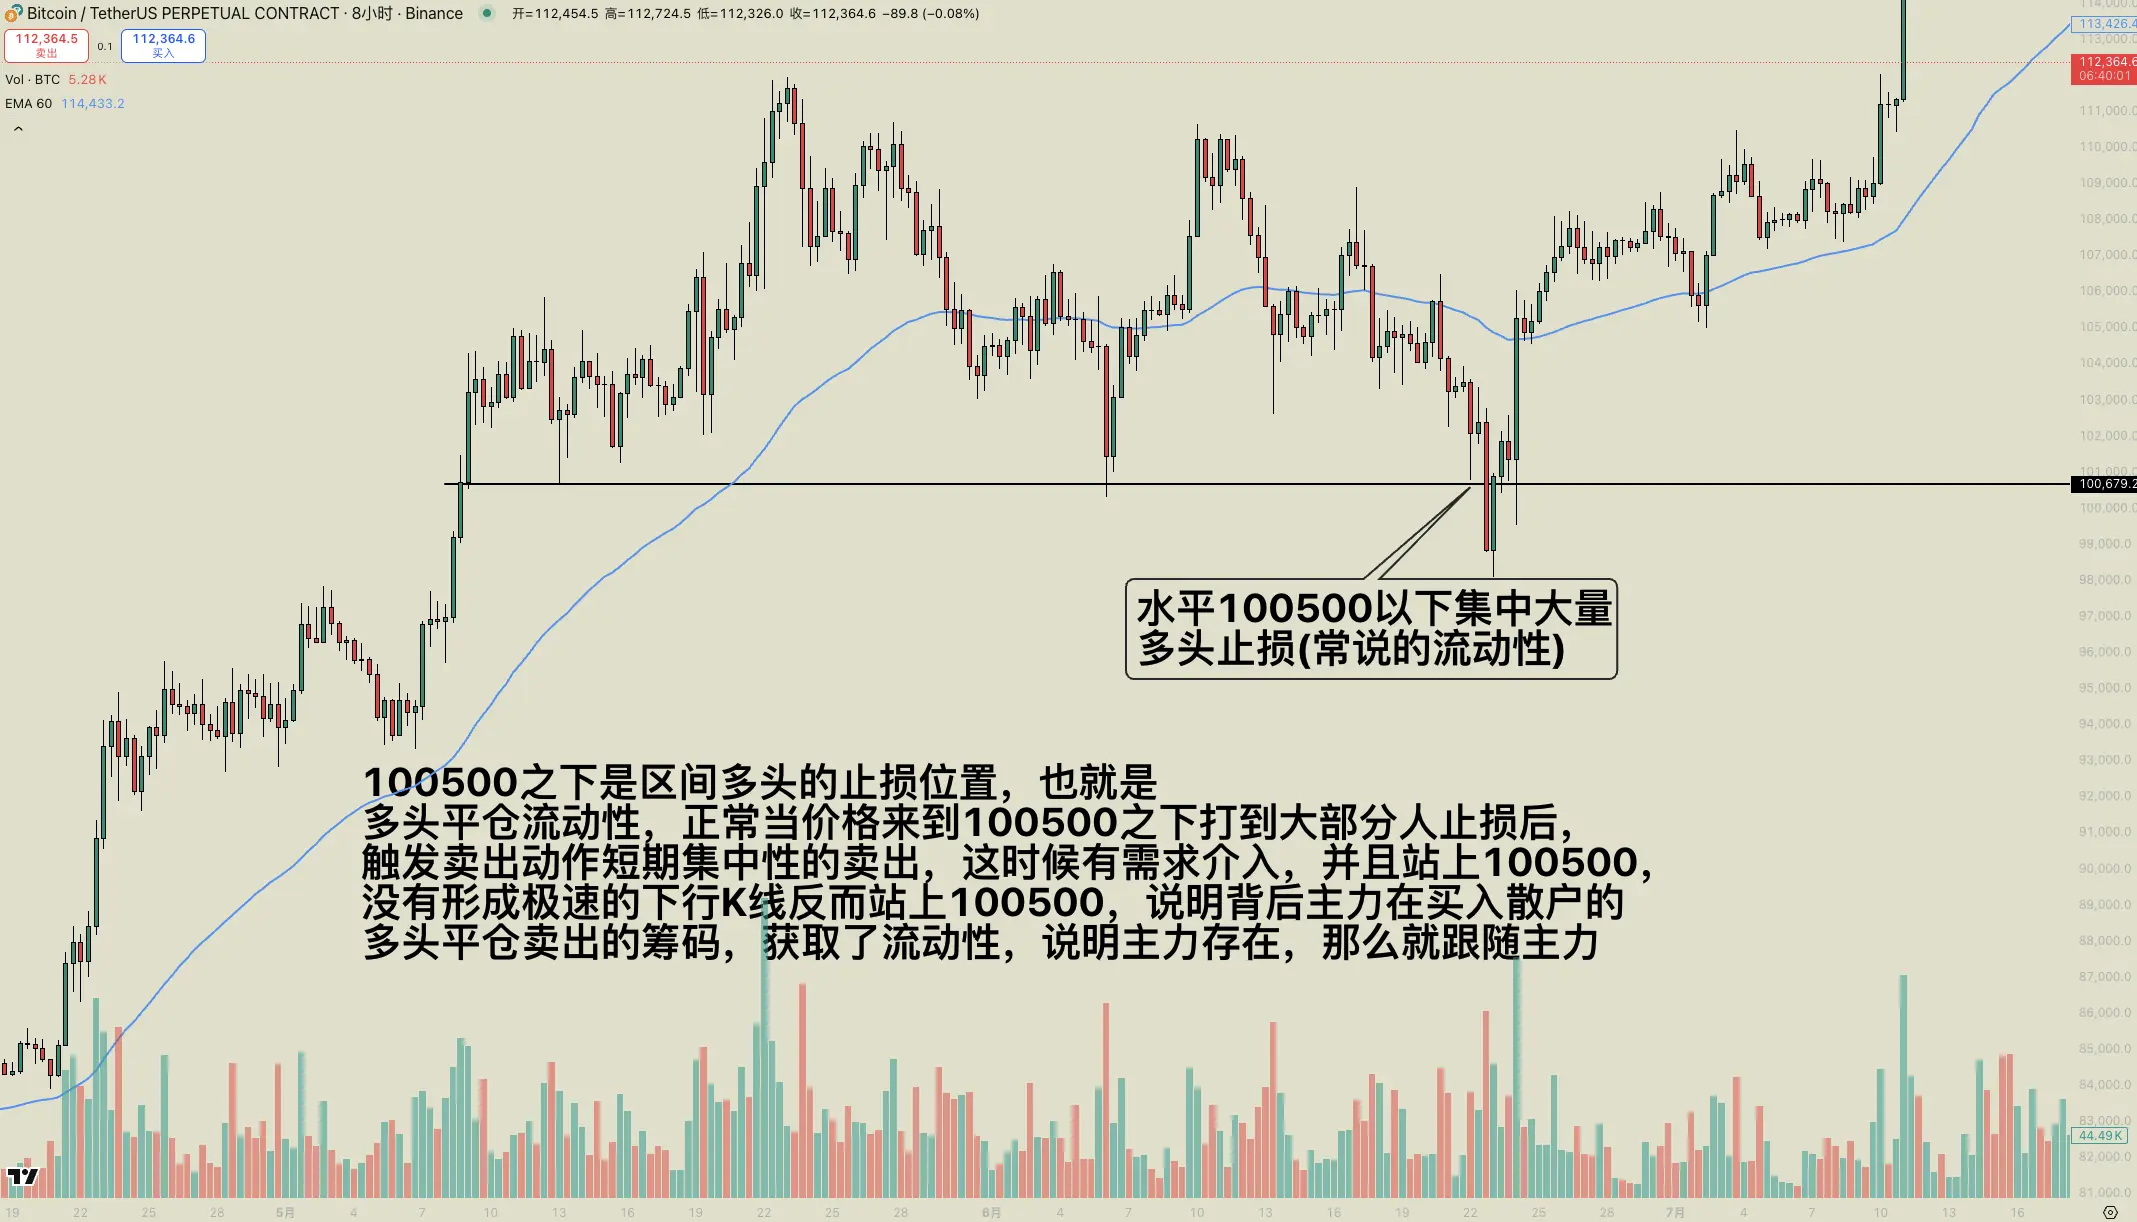
1. Long position closing: Previously bought (establishing a long position), now selling the contracts/stocks in hand (closing the position), what does the exchange do? The exchange matching system matches your "sell to close" order with others' "buy to open" or "buy to close" orders.
2. Short Covering: Previously sold (est
BTC-2.7%
- Reward
- 2
- Comment
- Repost
- Share
- Reward
- 1
- Comment
- Repost
- Share
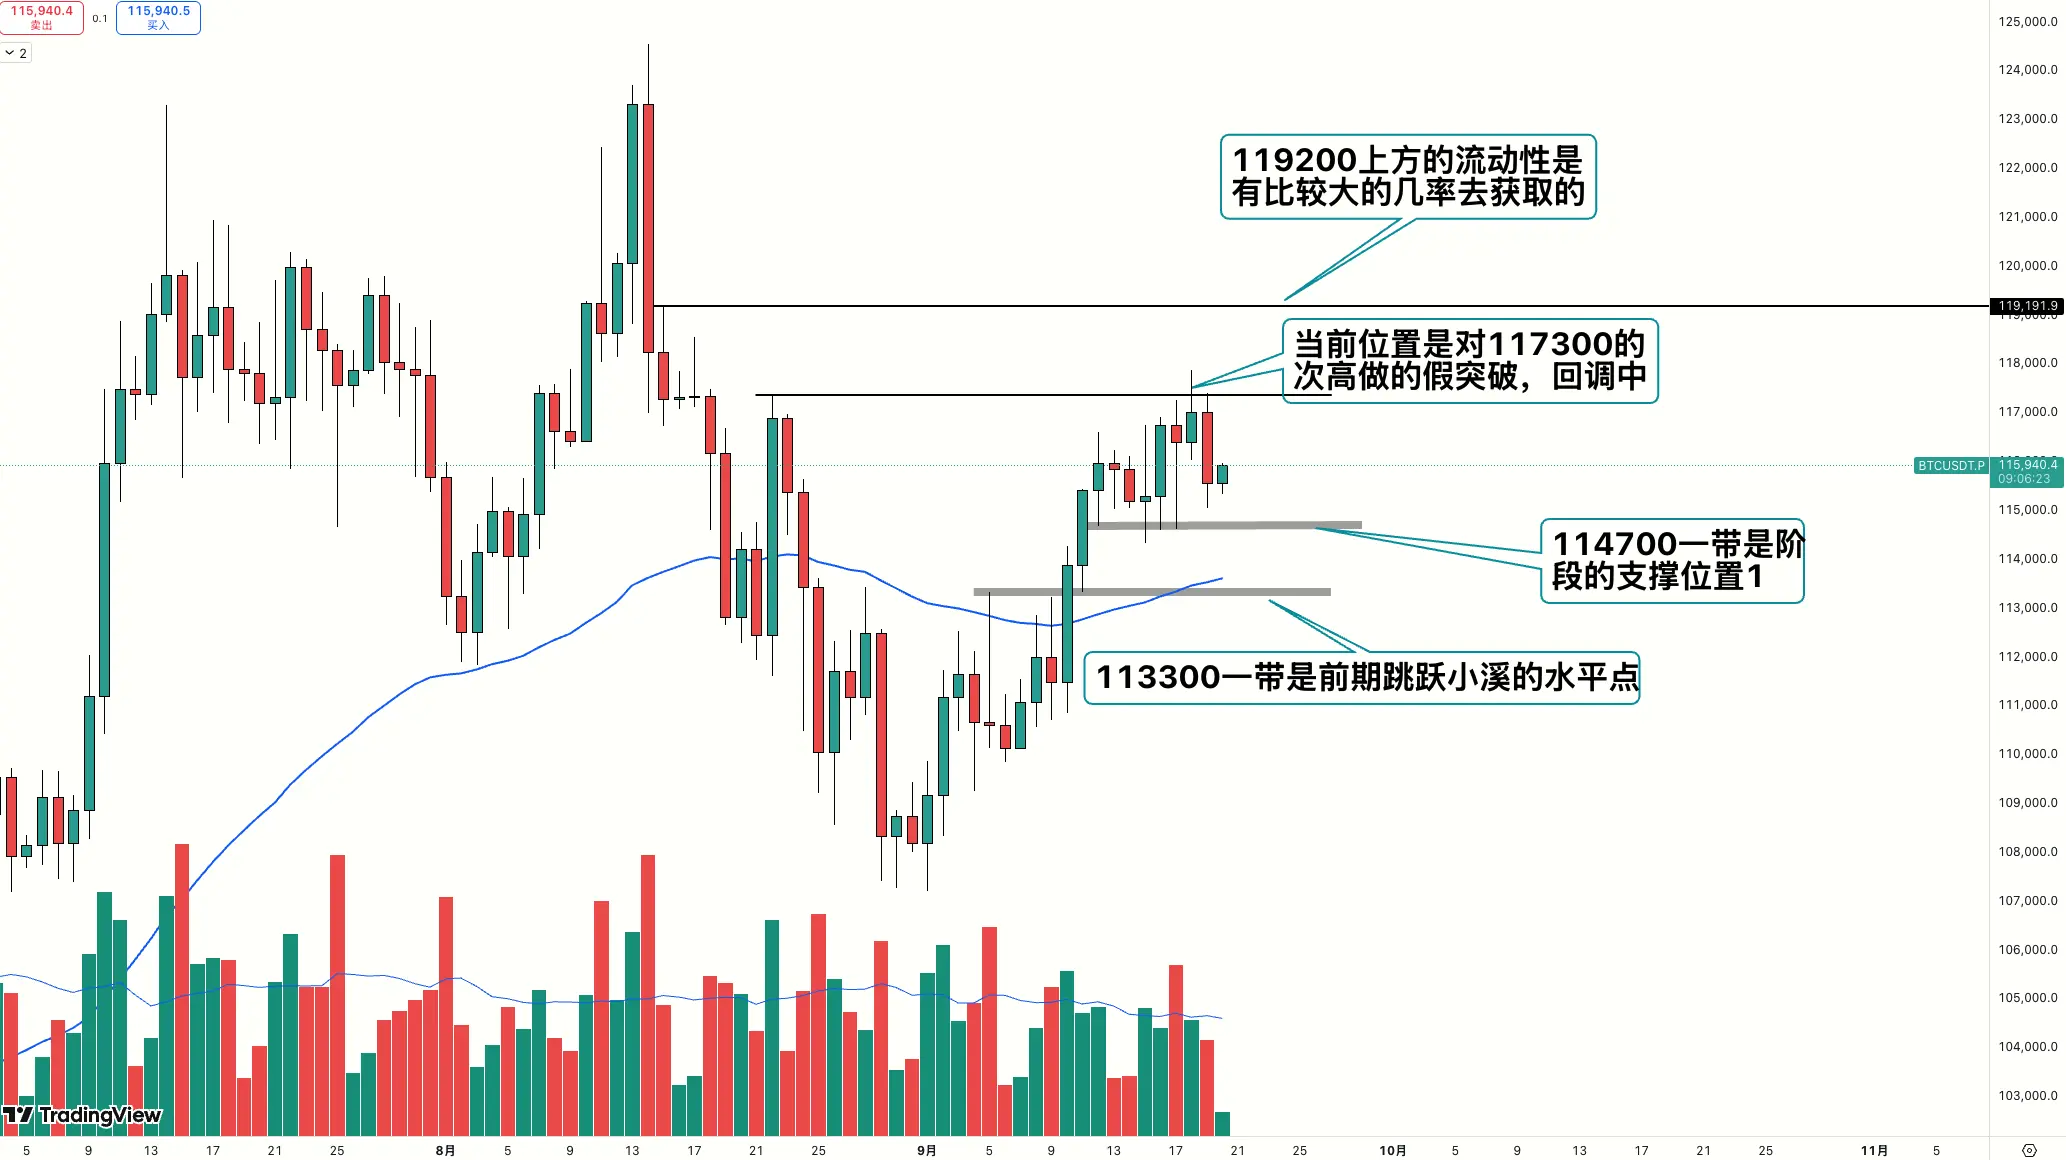
#BTC# daily chart analysis, there is greater liquidity above 1192, making it more reasonable to acquire below.
Currently, it is a pullback below the daily chart position after a false breakout at the high point of 117300, as shown in the figure.
First position: The 114700 area is still a support level.
Second position: The range around 113300 is a horizontal resistance point from the previous small jump in the creek, and a pullback will act as support.
Summary: After a likely pullback, it may still go up to test the range of 119200~120000. Pay close attention to these two support levels.
BTC-2.7%
- Reward
- like
- 3
- Repost
- Share
LittleSlyHead :
:
Quick, enter a position! 🚗View More
#BTC# Three points to note: 1. The gap above at 1136, 2. The lower level at 1105, and the second test around 108.
View Original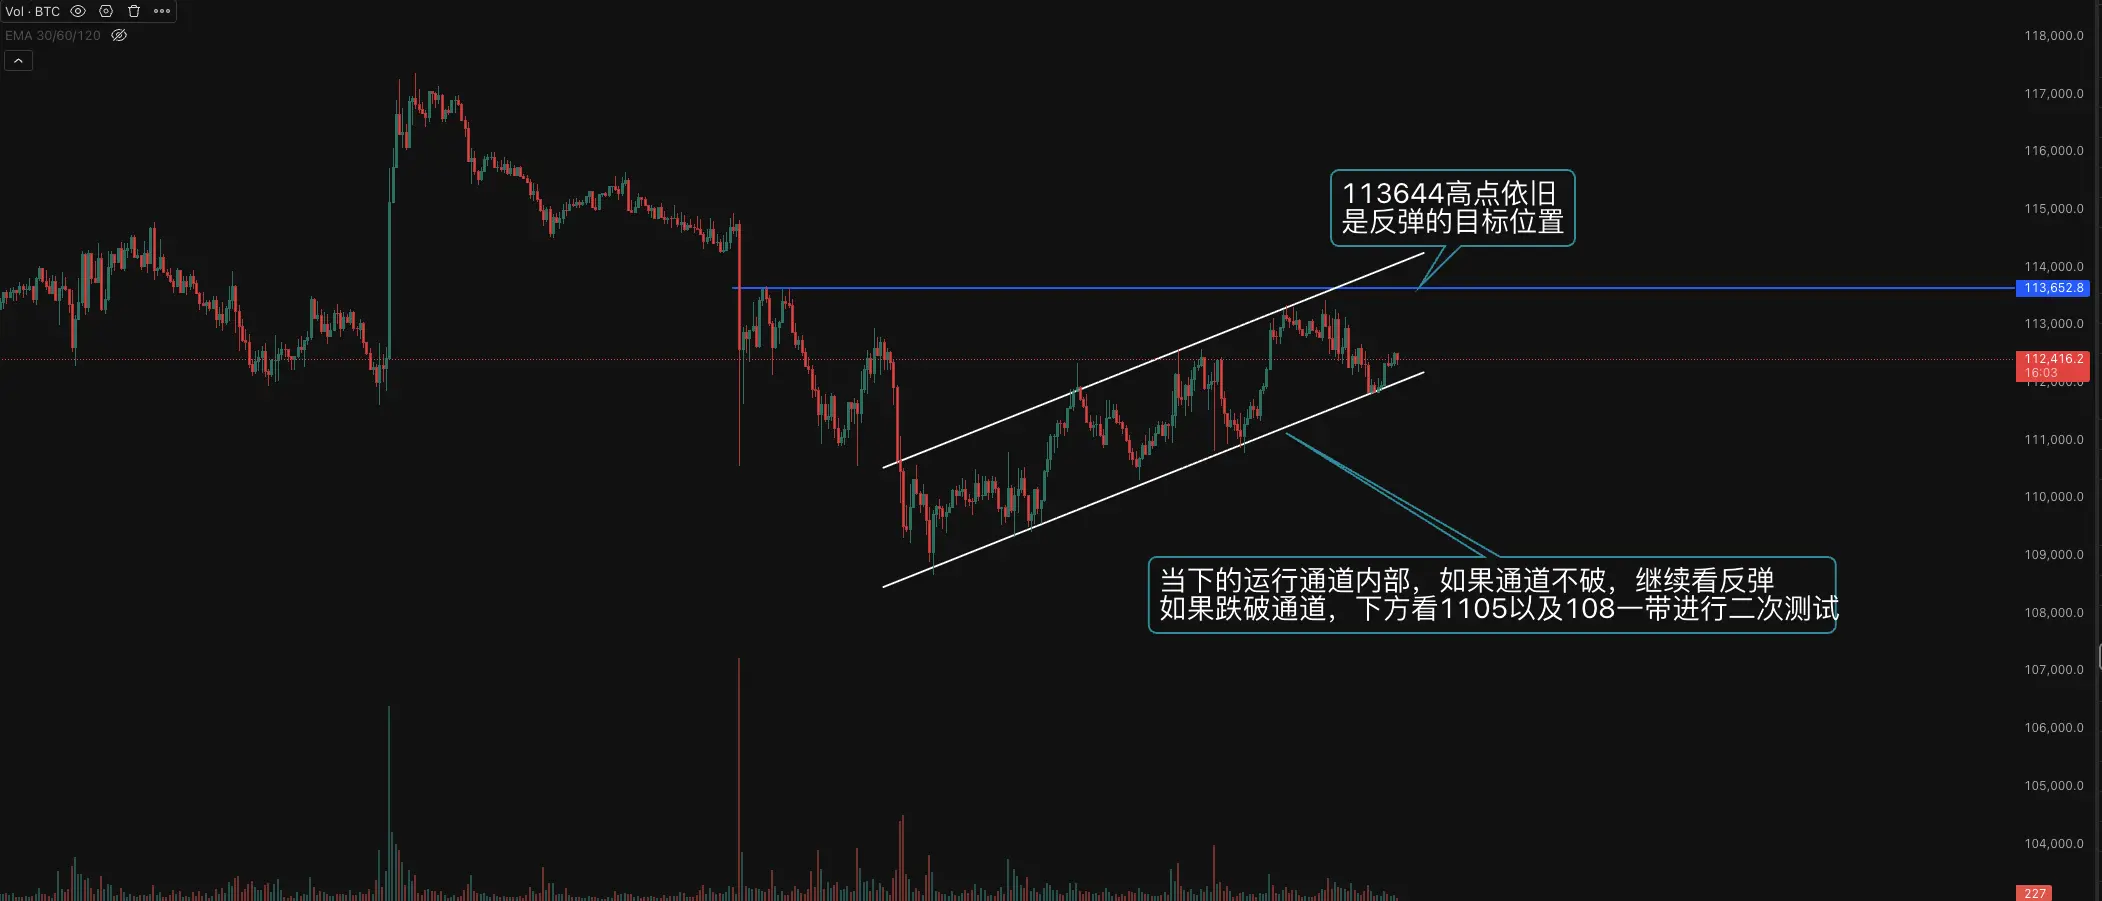
- Reward
- 1
- 5
- Repost
- Share
RidingTheWindAndWave:
Bro, are you losing money too much? You haven't been streaming.View More
Treasure opportunity discovered today
(Investment technology sharing, not investment advice)
View Original(Investment technology sharing, not investment advice)
Subscribers Only
Subscribe now to view exclusive content- Reward
- like
- 1
- Repost
- Share
IfWe_reGoingToScatter,We :
:
Live stream today?- Reward
- like
- Comment
- Repost
- Share
- Reward
- like
- Comment
- Repost
- Share
- Reward
- like
- 2
- Repost
- Share
RidingTheWindAndWave:
What have you been busy with lately, bro?View More
- Reward
- 1
- 2
- Repost
- Share
EternalWilderness :
:
It's been a long time since I last streamed.View More
- Reward
- like
- 3
- Repost
- Share
CangLetian2:
Make it clear.View More
As mentioned in the afternoon, try to operate at the key positions of the trading range.
View Original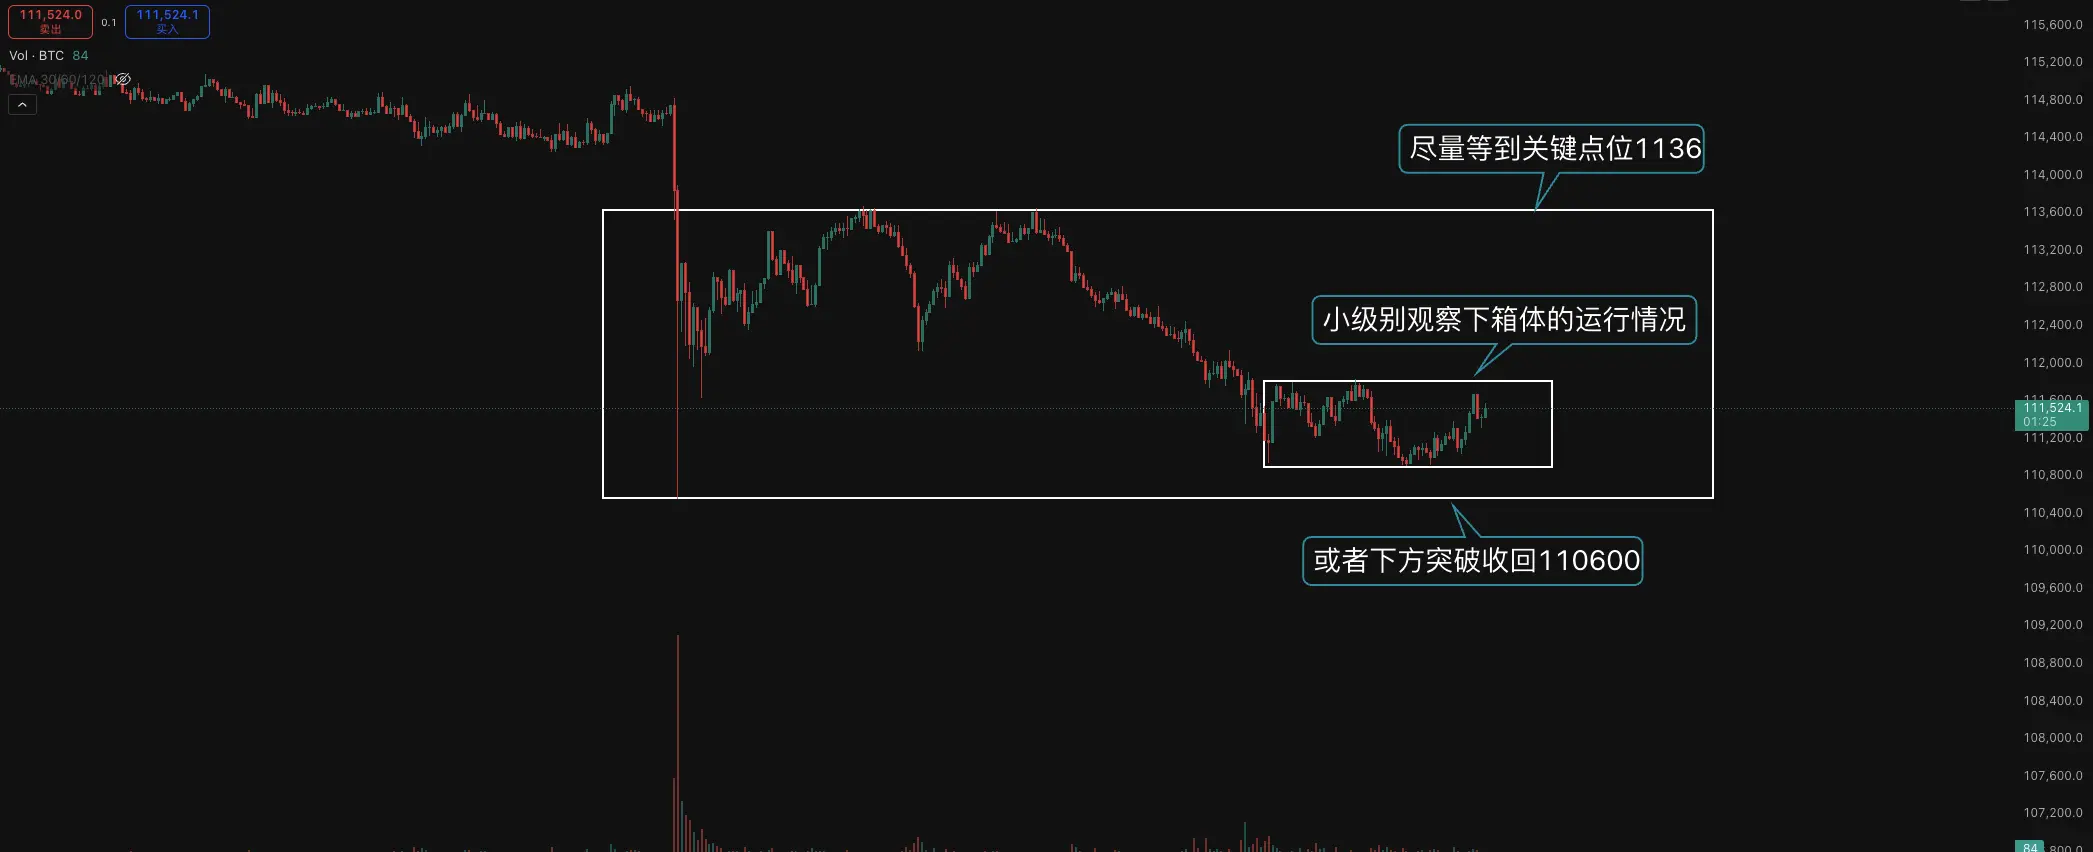
- Reward
- like
- 2
- Repost
- Share
RidingTheWindAndWave:
Start broadcastingView More
- Reward
- like
- 3
- Repost
- Share
RidingTheWindAndWave:
Where did the brother go?View More
Everyone take a look at the position of the large-scale BTC and Ether. Once it reaches that point, we can continue to consider long term.
View OriginalSubscribers Only
Subscribe now to view exclusive content- Reward
- 3
- 5
- Repost
- Share
LuckAndFortuneComeTo:
Excellent, excellent, thank you for your daily sharing. Learning from the excellent, thank you for your boundless love.View More
Tonight at 8 PM, Bots official live channel, I will be co-hosting a live stream with Gate trading Bots.
Live Channel Topic: The market continues to decline, where is the bottom? How to choose Bots strategies?
This live channel will issue 10 fan red envelopes, and more than 1000 people can receive the red envelopes, including an average of 100 million BABYDOGE and PEPE. Bots experience red envelopes will have 2 rounds of opportunities, and a total of 10 people can receive an average of 10 USDT experience red envelopes.
In addition, copying the Bots official and my bot strategies during the live
View OriginalLive Channel Topic: The market continues to decline, where is the bottom? How to choose Bots strategies?
This live channel will issue 10 fan red envelopes, and more than 1000 people can receive the red envelopes, including an average of 100 million BABYDOGE and PEPE. Bots experience red envelopes will have 2 rounds of opportunities, and a total of 10 people can receive an average of 10 USDT experience red envelopes.
In addition, copying the Bots official and my bot strategies during the live
- Reward
- 1
- Comment
- Repost
- Share
- Reward
- like
- 2
- Repost
- Share
EternalWilderness:
Steadfast HODL💎View More
Before bed reminder, BTC and Ether price levels
View OriginalSubscribers Only
Subscribe now to view exclusive content- Reward
- like
- Comment
- Repost
- Share