The Cardano (ADA) price is sitting at a level that usually separates panic from opportunity. After months of downside pressure, price is now pressing into a clearly defined demand zone, right where sellers historically lose control.
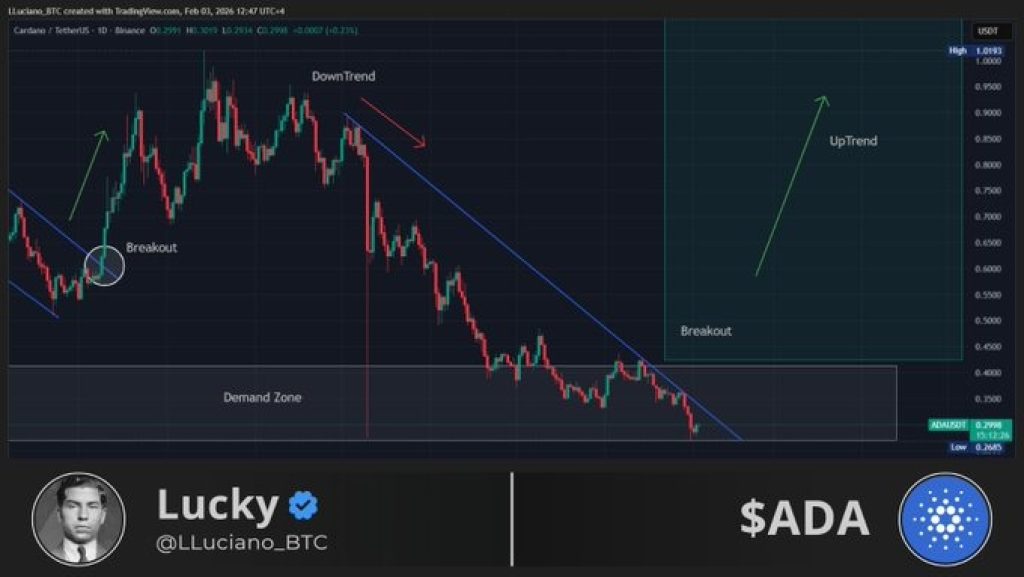
This setup was highlighted by top analyst Lucky who has over 1.9m followers on X, shared a clean chart showing why $ADA is now trading near what many would call max pain. Not because the price feels good here, but because it feels uncomfortable.
- What the Cardano Chart Is Showing
- Why This Zone Matters For Cardano Price
- What Comes Next For Cardano
What the Cardano Chart Is Showing
The chart shows the prolonged downtrend, with the price being forced lower step by step through the descending trend line, which has acted as an obstacle for every relief rally. The ADA price was forced lower through the trend line.
Now price sits inside a broad demand zone, an area where buyers previously stepped in aggressively. This is where downside moves have stalled in the past, not because sentiment improved, but because selling power ran out.
The most important detail is location. The $ADA price is no longer mid-range or chasing highs. It is sitting at the lower edge of structure, where risk compresses and reactions tend to start.
Source: X/Lucky
Why This Zone Matters For Cardano Price
Demand zones form when large buyers absorb supply over time. Price does not bounce instantly. It grinds, frustrates, and tests patience. That is usually how accumulation phases look.
In Lucky’s chart, the prior breakout and uptrend are clearly marked. Those moves began from similar conditions: extended downside, weak sentiment, and the ADA price pressing into areas where sellers were already exhausted.
If buyers defend this zone again, the downtrend line becomes the next key reference. A break above it would signal that control has started to rotate away from sellers.
_****5 Reasons You May Not Want to Ignore Hedera (HBAR) in 2026**
Furthermore, this setup is forming during a broader market drawdown. Not just crypto, but risk assets across the board have taken hits. That environment pushes fear higher and conviction lower.
That is exactly why these zones matter. Max pain does not appear during euphoria. It appears when confidence is thin and most participants are positioned the wrong way. The $ADA price does not need hype to move from here. It only needs selling to dry up.
What Comes Next For Cardano
As long as price holds inside the demand zone, the downside becomes increasingly limited relative to potential upside. A reclaim of the descending trendline would shift structure and open room for a broader recovery leg.
Until then, this remains a patience trade, not a momentum chase. The ADA chart is doing the talking, and it shows the Cardano price is sitting where decisions get made.
Whether this becomes another failed bounce or the start of a new trend will be decided right here.
Disclaimer: The information on this page may come from third parties and does not represent the views or opinions of Gate. The content displayed on this page is for reference only and does not constitute any financial, investment, or legal advice. Gate does not guarantee the accuracy or completeness of the information and shall not be liable for any losses arising from the use of this information. Virtual asset investments carry high risks and are subject to significant price volatility. You may lose all of your invested principal. Please fully understand the relevant risks and make prudent decisions based on your own financial situation and risk tolerance. For details, please refer to
Disclaimer.
Gerelateerde artikelen
Chainlink Holds $9.40 as ETF Inflows Top $111M and Demand Builds
Key Insights
LINK held near $9.40 as cumulative ETF inflows surpassed $111.5 million, indicating steady institutional demand over recent trading sessions.
Whale wallets accumulated nearly 2.8 million LINK while reserve balances rose, tightening available supply across active markets
CryptoNewsLand33m geleden
Solana Holds $86 as ETF Inflows Tighten Price Range
Key Insights:
Solana recorded five consecutive ETF inflow sessions, pushing cumulative assets above one billion dollars while selective outflows highlighted shifting institutional allocation strategies.
Price action remained supported above short-term averages, while long-term resistance
CryptoNewsLand39m geleden
XRP Price Compresses Near $1.45 as Inflows Rise and Signals Diverge
Key Insights:
XRP trades within a rising wedge as price compression continues, while steady ETF inflows and declining exchange reserves reflect sustained accumulation pressure.
Short-term momentum remains supported by a bullish MACD crossover, even as the broader pattern structure suggests a
CryptoNewsLand1u geleden
Dogecoin Holds $0.095 Support as Whale Buying Targets Breakout
Key Insights
Dogecoin holds above $0.095 support while whale wallets increased sharply, signaling steady accumulation during a prolonged consolidation phase.
Futures open interest rose to $1.37 billion as traders increased exposure ahead of a possible move above resistance.
Analysts
CryptoNewsLand1u geleden
Solana Price Holds Range as $90 Resistance Caps Breakout
Key Insightsthe price
Solana trades between $85 and $86 after a pullback, while an ascending channel pattern supports bullish structure with strong demand near support levels.
Momentum indicators, including MACD and Aroon, suggest strengthening buying pressure, reinforcing expectations of a
CryptoNewsLand2u geleden
Solana Price Compression Signals Breakout Toward $100
Key Insights:
Solana trades within a defined range between $77 and $94 as tightening Bollinger Bands signal potential volatility expansion and a decisive breakout ahead.
Institutional inflows into Solana products exceed $1.02 billion, although short-term activity shows mixed flows and
CryptoNewsLand2u geleden