Date: Thu, Dec 18, 2025 | 07:10 AM GMT
The broader cryptocurrency market has been experiencing choppy price action over the past several weeks, a phase that began after the sharp sell-off on October 10. That correction dragged Ethereum (ETH) down by nearly 22% over the last 60 days, keeping pressure firmly on major altcoins — including Avalanche (AVAX).
AVAX has slipped more than 12% over the past week alone, extending its 60-day decline to over 41%. While the short-term trend remains weak, a closer look at the higher-timeframe chart suggests that the sell-off may be approaching an area where downside momentum starts to fade.
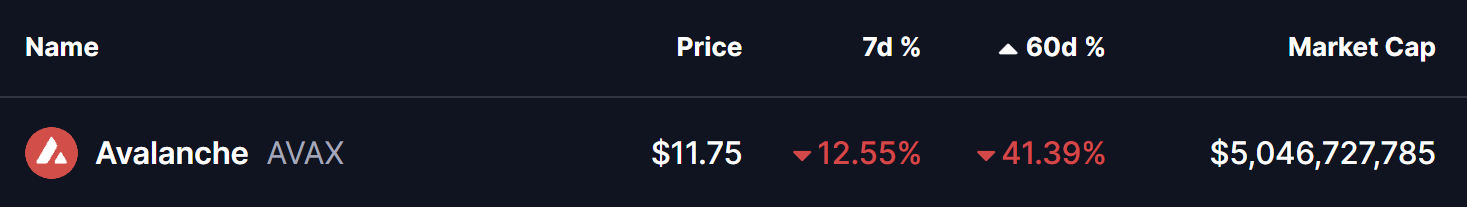
Source: Coinmarketcap
Falling Wedge Pattern in Play
On the weekly chart, AVAX continues to trade inside a well-defined falling wedge pattern. This structure has been guiding price action since early 2024 and is characterized by lower highs and lower lows that gradually compress into a narrowing range. Historically, falling wedges often reflect slowing selling pressure rather than aggressive distribution.
As shown on the chart, the latest decline has pushed AVAX directly into the lower boundary of this wedge, near the $11.64 region. This zone has acted as a critical demand area in the past, repeatedly attracting buyers and triggering short-term rebounds. Once again, price is reacting near this level, suggesting that sellers may be losing strength as AVAX presses into long-term support.
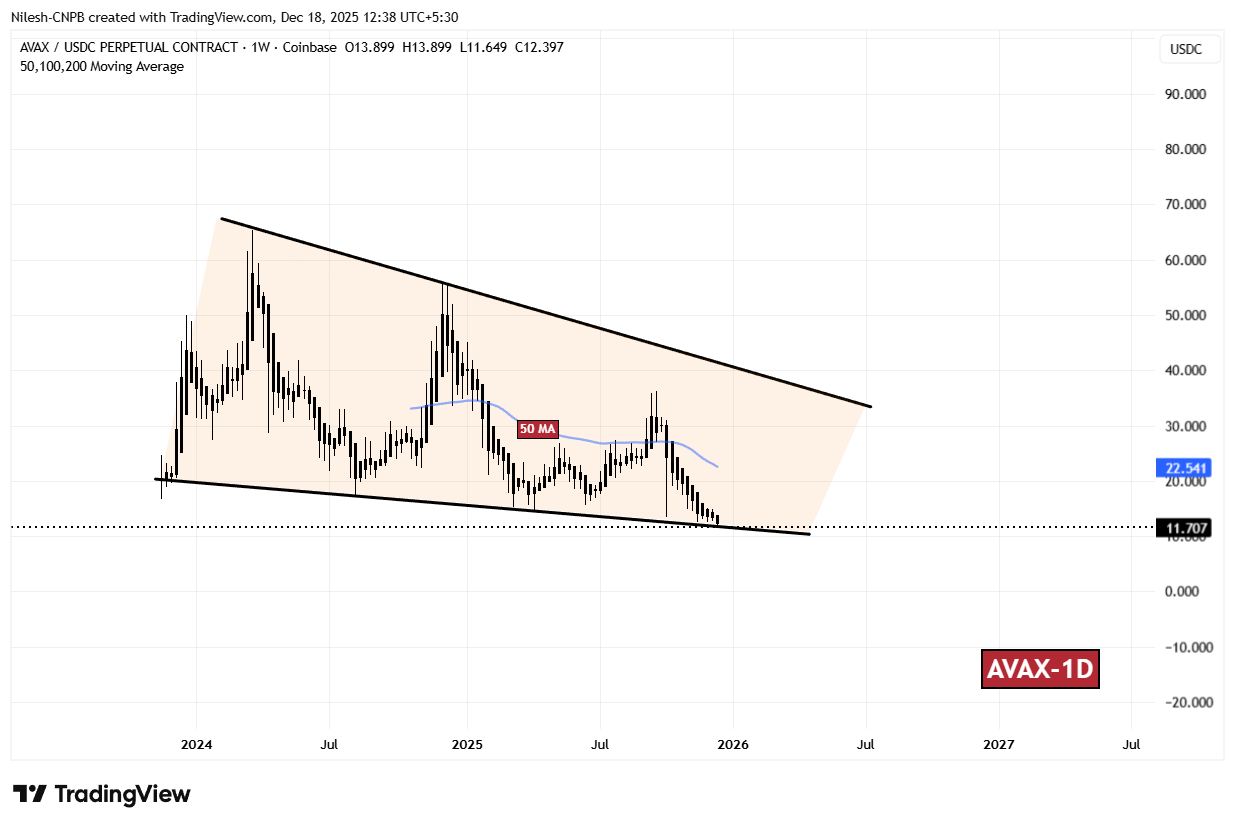
AVAX Weekly Chart/Coinsprobe (Source: Tradingview)
The repeated defenses of the wedge’s lower trendline, combined with shrinking downside follow-through, point to growing indecision rather than panic selling. This behavior often precedes a stabilization phase or a relief bounce.
What’s Next for AVAX?
If AVAX continues to hold above the wedge floor, the focus will shift to whether buyers can reclaim key overhead levels. The first major hurdle sits at the 50-week moving average, currently near $22.54. This level has consistently acted as dynamic resistance during prior recovery attempts and remains a key marker for any trend change.
A sustained move above this moving average would strengthen the bullish case and potentially open the door for a push toward the upper boundary of the falling wedge. Reaching that zone would signal a meaningful shift in market structure and sentiment.
That said, the setup remains conditional. A decisive weekly close below the wedge’s lower boundary would invalidate the pattern and expose AVAX to further downside risk, with the next notable support area emerging near the $9.00 level.
For now, AVAX sits at a technically important crossroads. While broader market conditions remain fragile, the compression within this falling wedge suggests that a larger move may be approaching — with the coming weeks likely to determine whether this support zone becomes a base for recovery or a stepping stone to deeper losses.
Disclaimer: The views and analysis presented in this article are for informational purposes only and reflect the author’s perspective, not financial advice. Technical patterns and indicators discussed are subject to market volatility and may or may not yield the anticipated results. Investors are advised to exercise caution, conduct independent research, and make decisions aligned with their individual risk tolerance.
Disclaimer: The information on this page may come from third parties and does not represent the views or opinions of Gate. The content displayed on this page is for reference only and does not constitute any financial, investment, or legal advice. Gate does not guarantee the accuracy or completeness of the information and shall not be liable for any losses arising from the use of this information. Virtual asset investments carry high risks and are subject to significant price volatility. You may lose all of your invested principal. Please fully understand the relevant risks and make prudent decisions based on your own financial situation and risk tolerance. For details, please refer to
Disclaimer.
Gerelateerde artikelen
PI Network (PI) Price Predictions for This Week
PI Network's price has corrected from $0.30 to $0.17, indicating a 40% drop. Currently, it hovers around $0.18, presenting a bearish outlook unless it surpasses $0.20. Volume remains low, suggesting indecision among sellers, while the RSI stays under 50, signaling further potential declines.
CryptoPotato4m geleden
BTC 15分钟下挫0.58%:链上资金流动加速与宏观不确定性共振引发调整
2026-03-31 09:45至10:00(UTC),BTC在15分钟内收益率录得-0.58%,行情区间为65996.1-66509.1 USDT,振幅0.77%,短线波动加剧引发市场关注。链上转账总量达到42万美元,交易笔数高达27,986,显示资金快速流动,市场参与度阶段性提升,但整体交投仍趋谨慎。
本次异动的主要驱动力是链上大额资金调仓行为与资金流动加速。链上数据显示转账总量及笔数双双攀
GateNews18m geleden
ETH 15分钟下跌0.61%:主力资金加速流出与链上活跃度下降共振压制行情
2026-03-31 09:45 至 2026-03-31 10:00(UTC)期间,ETH价格在2012.5至2030.74 USDT间震荡,15分钟K线收益率为-0.61%,振幅达到0.90%。在主流币种中表现偏弱,市场短线关注度提升,波动略有加剧,抛盘压力释放明显。
本次异动的主要驱动力是主力资金在全天范围持续流出,09:45–10:00期间流出力度进一步加大。据链上与交易数据显示,3月3
GateNews18m geleden
Ethena Revenue Drops 32% as ENA Tests Key $0.089 Support
Revenue dropped 32%, reflecting weaker network activity and reduced participation.
TVL and daily users declined, signaling capital outflows and fading engagement.
Spot buying persists, but weak fundamentals limit strong upside potential.
Ethena has entered a critical phase as price
CryptoNewsLand29m geleden
数据:比特币和以太坊历史 4 月平均回报率分别为 +13.06% 和 +19.98%
截至3月31日,2026年第一季度比特币和以太坊回报率分别为-23.15%和-31.81%,远低于历史平均。同时,比特币和以太坊的4月平均回报率历史上表现良好,分别为+13.06%和+19.98%。
GateNews34m geleden
