Kaspa (KAS) is showing serious resilience even as its price remains near lows. Kaspa’s hash rate is holding near all-time highs, showing miners aren’t stepping back and the network’s backbone is rock solid.
A major hardfork is coming on May 5, bringing native tokens and more programmability. This could open the door to DeFi, NFTs, and all kinds of new ways for developers to build on Kaspa.
Meanwhile, Rusty Kaspa v1.1.0 is out, making the network faster and smoother for developers. In all these developments, it is clear that the project is playing the long game rather than focusing on the price.
- Here’s What The Kaspa Chart is Showing
- Market Indicators
- Here’s Where Kaspa Price Could Go This Week
Here’s What The Kaspa Chart is Showing
On the 4-hour chart, the KAS price has spent the past few weeks in a steady downtrend, forming lower highs and lower lows. The structure started to change once the price found a footing around $0.0249.
It spent some time drifting sideways, gathering energy, before surging past $0.034 with solid momentum.
That move signaled buyers returning to the market. Right now, KAS is trading near $0.03626, taking a small breather after the recent rally This kind of movement is typical after a sharp push higher, as the market takes time to cool off and reassess direction.
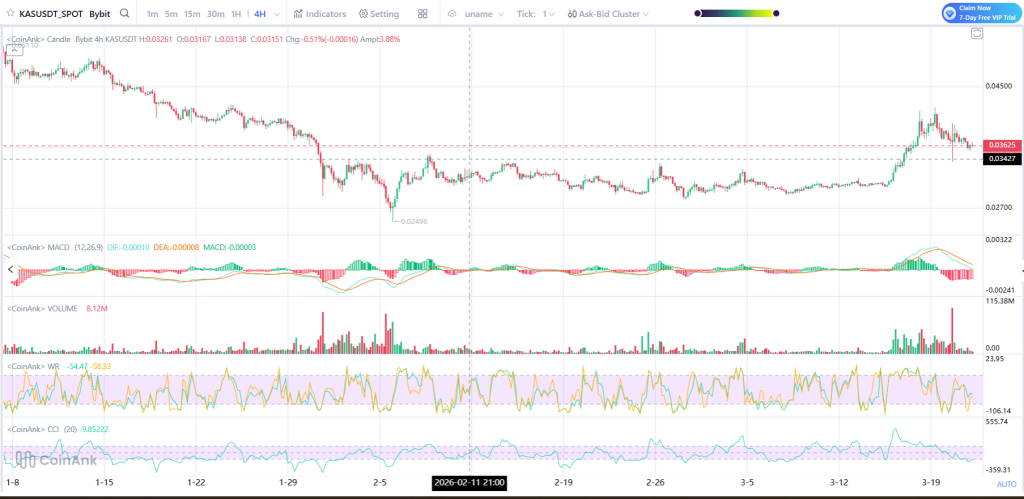
Source: Coinank
Market Indicators
The MACD flipped bullish during the breakout, which showed strong momentum at the time. But now it’s starting to cool off a bit, meaning the rally is slowing down, not necessarily reversing.
Volume tells a similar story. It spiked during the move up, which is a good sign, but it’s dropping now as traders pause and wait for the next direction.
Williams %R went into overbought levels and is pulling back, suggesting the KAS price might take a short break or dip slightly.
CCI is also coming down after the spike, showing that momentum is easing off for now rather than turning fully bearish.
_****Could the Bittensor (TAO) Rally Be Over? Fundamentals and Sentiment Point in Opposite Directions**
Here’s Where Kaspa Price Could Go This Week
$0.034 is the line in the sand right now. As long as buyers keep their grip here, Kaspa could quietly creep up toward $0.038–$0.040.
Breaking past $0.040 with conviction would flip the switch, potentially sending it to $0.042 and even $0.045 if the market mood stays positive.
But if $0.034 cracks, the setup starts to unravel. A fall toward $0.030–$0.031 would be likely, and if selling heats up, $0.027 is the next solid landing spot for KAS price where buyers have stepped in before.
However, Kaspa (KAS) is now displaying early signs of a recovery from a prolonged period of decline. From the above chart, it is evident that the price of Kaspa is breaking out with strong volumes, indicating the entry of buyers into the market. At the same time, the price is also displaying signs of a cooling period.
So long as the Kaspa price trades above the key levels of the chart, the structure of the price is gradually favoring the bulls. With strong fundamentals and upcoming network upgrades, Kaspa is now building a foundation for a possible price action.
Disclaimer: The information on this page may come from third parties and does not represent the views or opinions of Gate. The content displayed on this page is for reference only and does not constitute any financial, investment, or legal advice. Gate does not guarantee the accuracy or completeness of the information and shall not be liable for any losses arising from the use of this information. Virtual asset investments carry high risks and are subject to significant price volatility. You may lose all of your invested principal. Please fully understand the relevant risks and make prudent decisions based on your own financial situation and risk tolerance. For details, please refer to
Disclaimer.
Articoli correlati
PEPE Reclaims 0.00000400 — Is This 1.8% Move the Start of a Bigger Run?
PEPE rebounds from 0.00000385 support, forming higher lows and stronger bullish structure.
Technical indicators like MACD and RSI show momentum with room for further upside.
Key resistance at 0.00000410; support at 0.00000380 critical for trend continuation.
PepeCoin — PEPE, has
CryptoNewsLand3h fa
ETH 15分钟下跌0.58%:衍生品流动性收缩与主动减仓主导短线回调
2026-04-19 04:30 至 2026-04-19 04:45(UTC),ETH在15分钟K线内收益率录得-0.58%,价格区间处于2321.62至2342.04 USDT,振幅达到0.87%。短线跌势发生在市场整体波动加剧、主流加密资产价格普遍下行背景下,市场风险偏好明显下降,交易者观望情绪增强。
本次异动的主要驱动力是衍生品市场流动性的大幅收缩及杠杆资金主动减仓。数据显示,24小时
GateNews4h fa
Spark Protocol's January delisting of rsETH proves prudent as Aave faces ETH liquidity crisis
Spark Protocol's strategy of delisting low-usage assets and tightening collateral has faced initial backlash but proved wise during market turmoil. While maintaining higher interest rate caps, SparkLend ensures liquidity, unlike Aave, which now faces significant risks.
GateNews5h fa
Request Network (REQ) Surges 23.68% in 15 Minutes, 24-Hour Gain Reaches 116.52%
Request Network (REQ) surged 23.68% in just 15 minutes, reaching $0.152, with a 24-hour rise of 116.52% and trading volume over $8 million. Factors include retail interest and whale accumulation. Resistance at $0.160 and support at $0.122 are under observation.
GateNews6h fa
Solana Price Stalls Near $80 as ETF Outflows Weigh
Solana trades around $80, facing bearish sentiment due to ETF outflows and declining retail participation. Technical indicators show mixed signals, with resistance at $87 and $98, while support at $77 remains critical for stability.
CryptoFrontNews10h fa
Dogecoin Holds $0.094 as X Cashtags Drive Market Attention
Key Insights
Dogecoin holds above $0.094 despite market weakness as Bitcoin and Ethereum stabilize, reflecting resilience and sustained demand across major cryptocurrencies during the consolidation phase.
X launches smart cashtags enabling real-time crypto and stock tracking, improving marke
CryptoNewsLand14h fa
