LUMINT vs DYDX: A Comprehensive Comparison of Two Leading Decentralized Exchange Protocols


Introduction: LUMINT vs DYDX Investment Comparison
In the cryptocurrency market, the comparison between LUMINT and DYDX has always been a topic that investors cannot avoid. The two not only exhibit significant differences in market capitalization ranking, application scenarios, and price performance, but also represent distinct positioning within the crypto asset landscape. LUMINT (LUMINT): Led by the Neural Trust Foundation, it combines blockchain and AI technologies to deliver sustainable rewards for token holders and node operators while enhancing token value through advanced AI-driven services. DYDX (DYDX): Since its launch in 2021, it has been recognized as a decentralized derivatives trading protocol that enables margin trading through ERC20 tokens via Ethereum smart contracts. DYDX operates as a decentralized perpetual futures exchange on L2 blockchain systems while offering spot, margin, and lending services on L1. This article will comprehensively analyze the investment value comparison between LUMINT and DYDX from multiple dimensions including historical price trends, supply mechanisms, market adoption, technical ecosystems, and future outlook, while attempting to answer the most pressing question investors face:
"Which is the better buy right now?"
Comparative Analysis Report: LUMINT vs dYdX
December 18, 2025
I. Price History Comparison and Current Market Status
LUMINT and dYdX Historical Price Trends
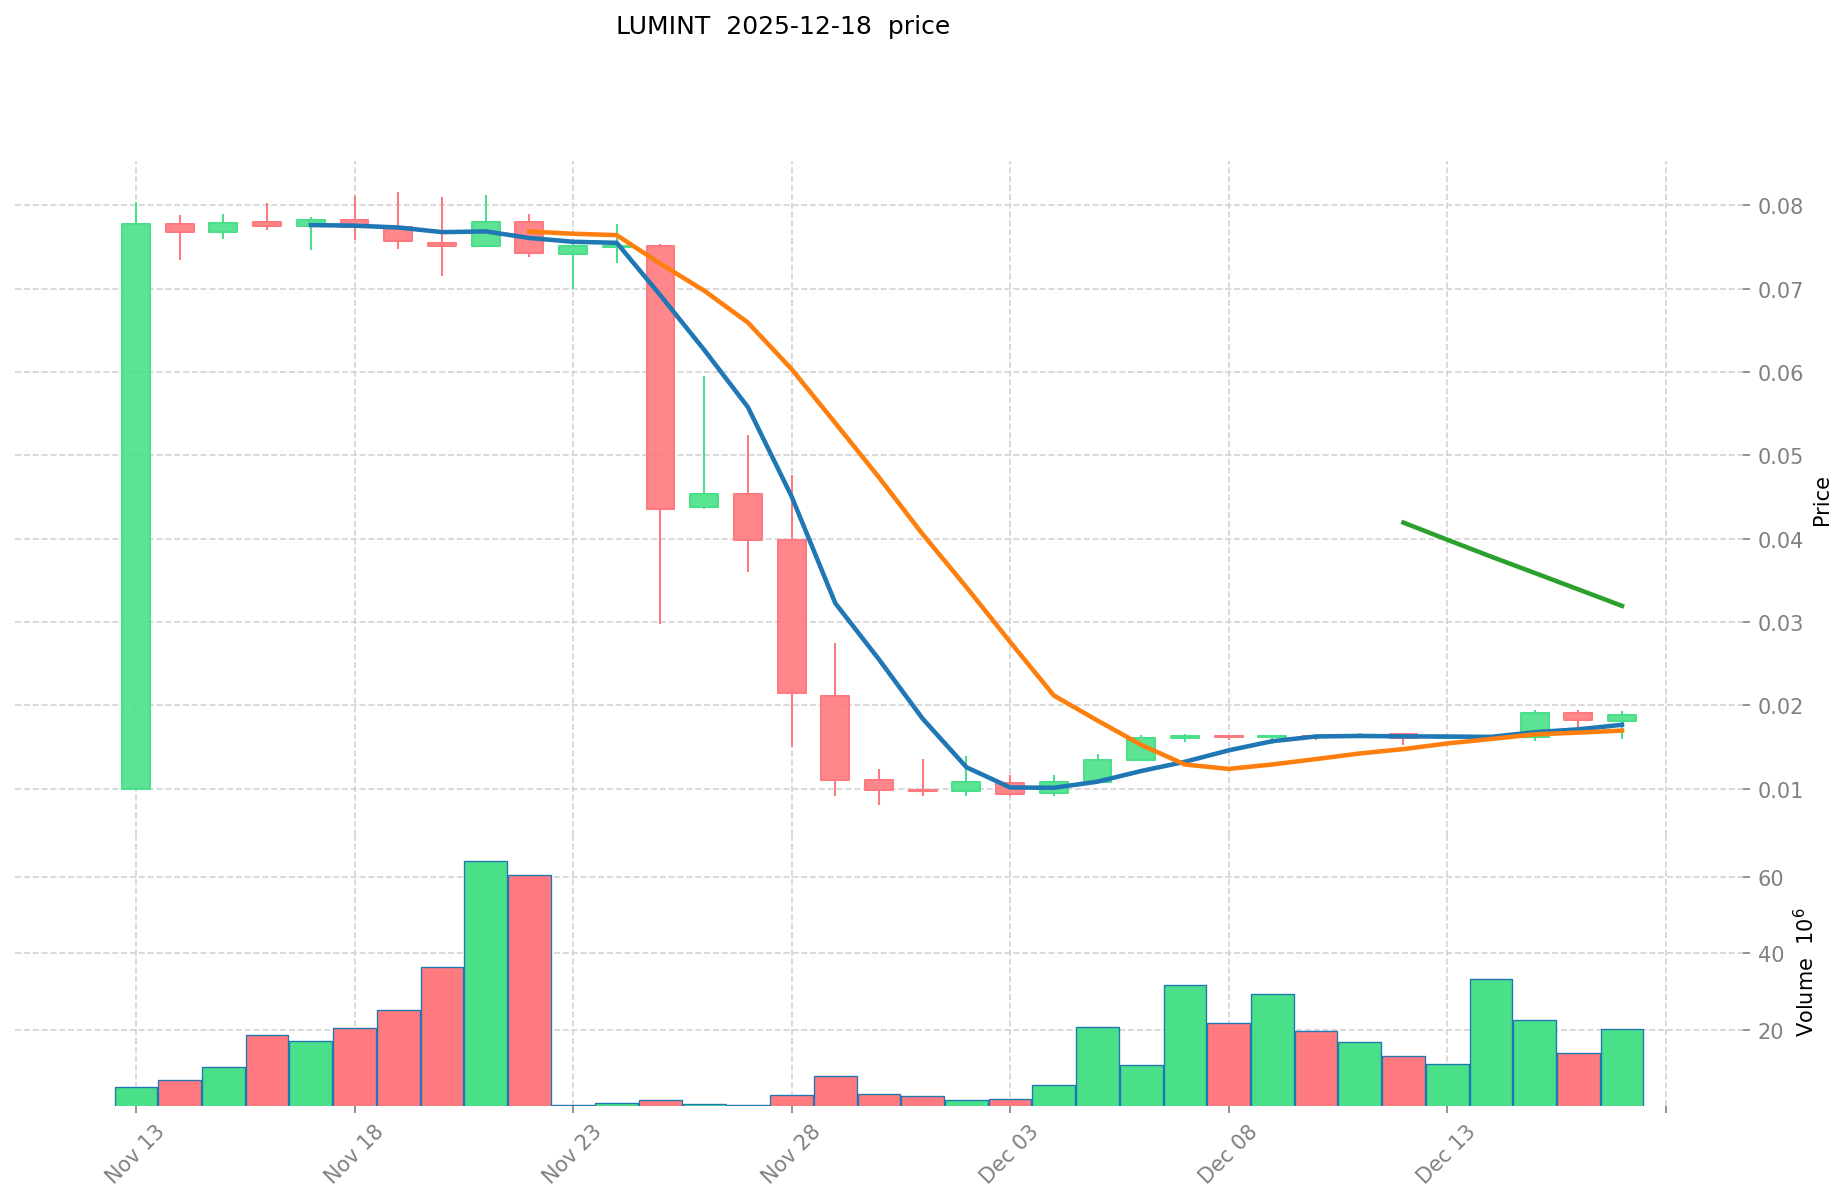
LUMINT (LUMINT) demonstrates significant volatility since its inception, with a historical all-time high of $0.08162 recorded on November 19, 2025, and a historical low of $0.00799 on November 30, 2025. This represents a dramatic 92% decline from peak to trough within a compressed timeframe.
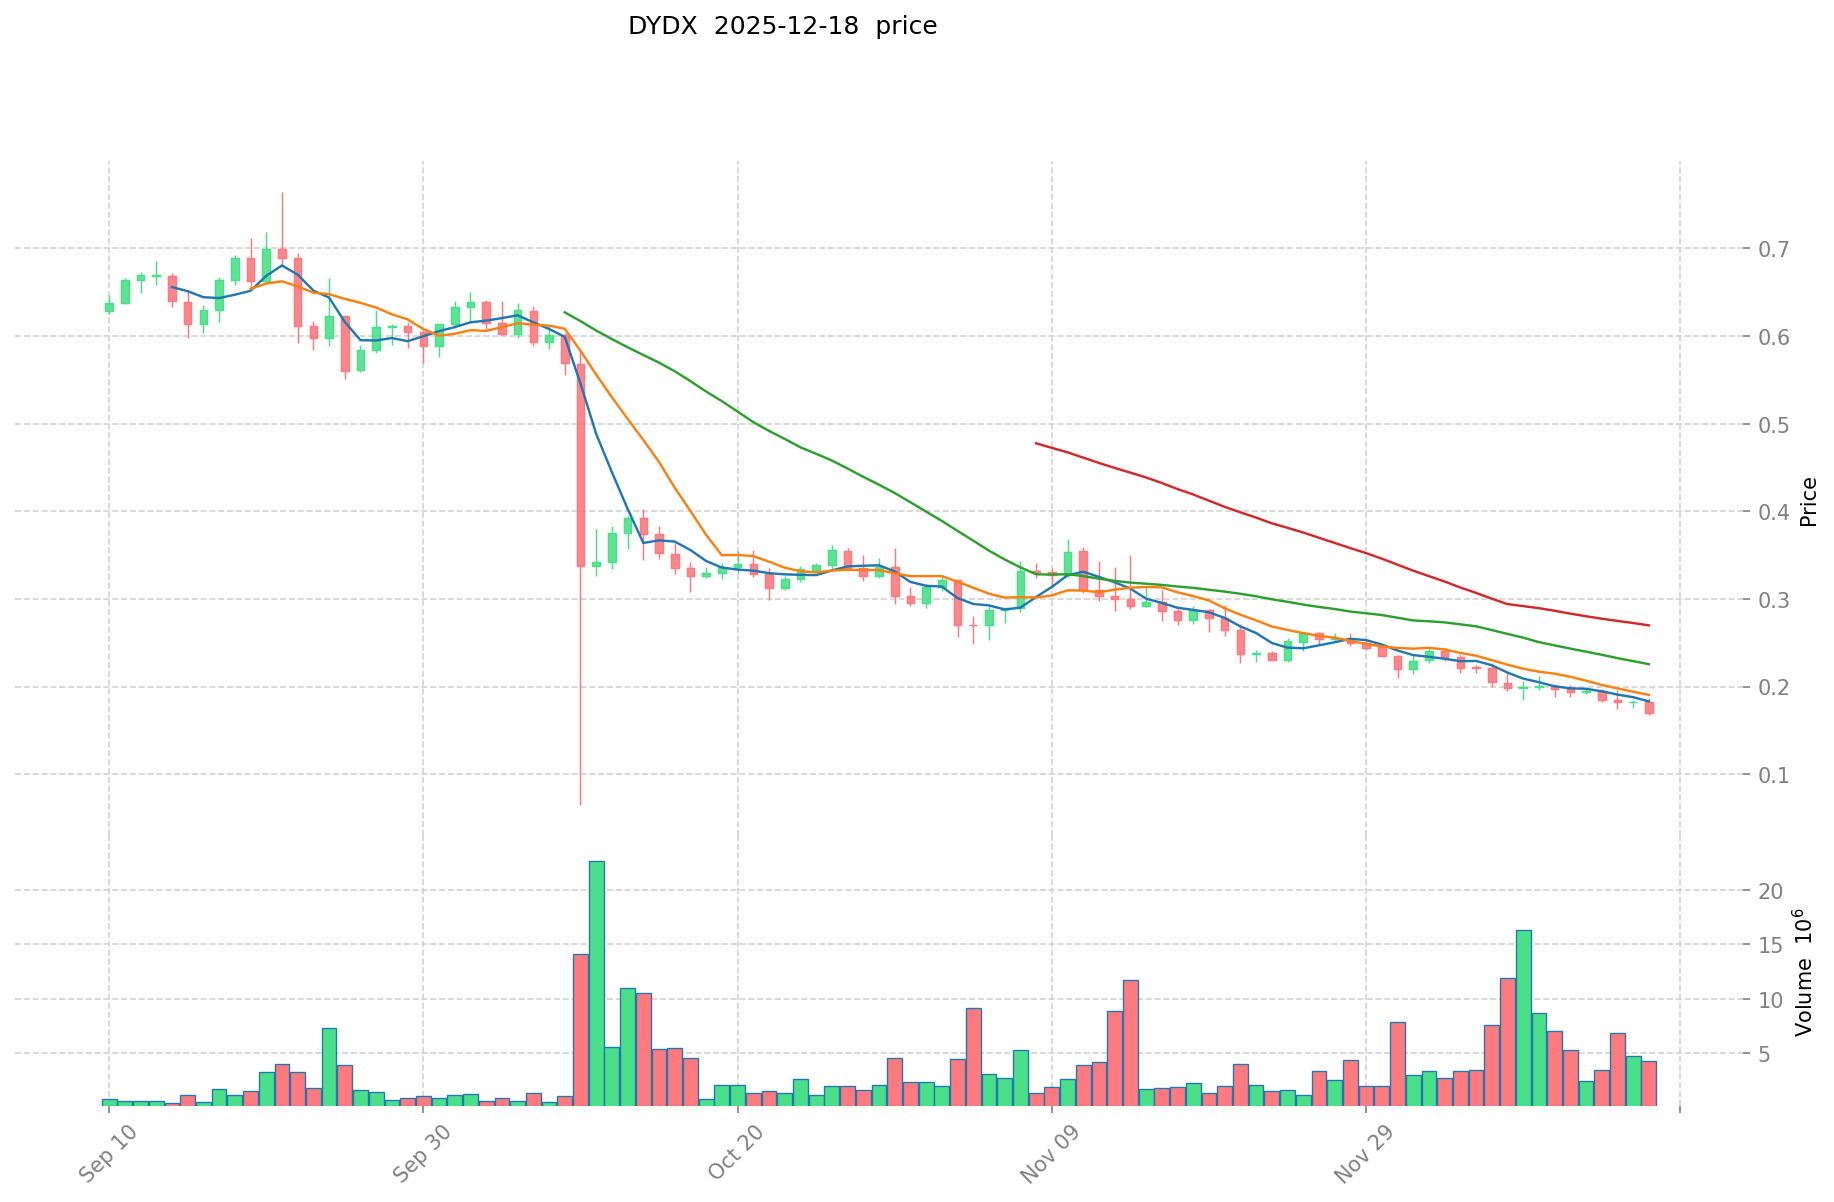
dYdX (DYDX), as an established decentralized derivatives trading protocol, exhibits a longer market history with an all-time high of $4.52 on March 8, 2024, and a recent low of $0.126201 on October 11, 2025. The token has experienced a cumulative decline of approximately 96% from its historical peak.
Comparative Analysis: Both assets display substantial downward pressure over their respective trading histories. LUMINT's extreme volatility within a narrow timeframe contrasts with dYdX's longer-term depreciation cycle, suggesting different risk profiles and market maturity levels.
Current Market Snapshot (December 18, 2025)
| Metric | LUMINT | dYdX |
|---|---|---|
| Current Price | $0.019155 | $0.1699 |
| 24-Hour Trading Volume | $375,262.03 | $732,822.67 |
| Market Capitalization | $57,465,000 | $162,822,433.39 |
| Market Rank | #461 | #278 |
| Circulating Supply | 3,000,000,000 | 813,317,306.90 |
| Total Supply | 3,000,000,000 | 958,342,751 |
Market Emotion Index (Fear & Greed Index): 17 - Extreme Fear
Access real-time price data:
II. Short-Term Price Performance Analysis
Price Movement Across Multiple Timeframes
LUMINT Performance:
- 1 Hour: +0.89%
- 24 Hours: +7.76%
- 7 Days: +19.39%
- 30 Days: -74.94%
- 1 Year: -72.91%
dYdX Performance:
- 1 Hour: +0.95%
- 24 Hours: -6.53%
- 7 Days: -11.62%
- 30 Days: -38.87%
- 1 Year: -91.23%
Analysis: LUMINT shows recent short-term recovery momentum (positive trends in 1-hour, 24-hour, and 7-day timeframes) despite severe medium-to-long-term losses. dYdX demonstrates more consistent downward pressure, with negative performance across all timeframes except the 1-hour period. The divergence suggests LUMINT may be in a technical rebound phase, while dYdX exhibits sustained bearish sentiment.
III. Project Overview and Technical Specifications
LUMINT
LUMINT is a global initiative led by the Neural Trust Foundation that combines blockchain and artificial intelligence technologies to deliver sustainable rewards for token holders and node operators. The project enhances token value through advanced AI-driven services.
Key Features:
- Hybrid model incorporating node staking, AI service integration, and intelligent mining systems
- Focus on decentralized finance (DeFi) combined with innovative asset management
- Mission to address long-standing challenges in blockchain and cryptocurrency markets
- Sustainability emphasis for price stability, long-term growth, and real-world application
Technical Specifications:
- Blockchain: BSC (Binance Smart Chain)
- Token Standard: BEP-20
- Contract Address: 0x772a520b28738a275fea3572f132dd16daa6be12
- Holders: 2,145
- Exchange Listings: 2
dYdX
dYdX is a decentralized derivatives trading protocol established in 2017, providing margin trading and perpetual contracts through Ethereum-based smart contracts. The platform operates as a non-custodial decentralized exchange (DEX) using a hybrid infrastructure model combining on-chain settlement with off-chain order matching.
Core Features:
- Support for spot trading, margin leverage, and perpetual contract trading
- Layer 2 scaling integration (StarkWare's StarkEx technology)
- Zero gas trading through second-layer solutions
- Central limit order book (CLOB) model for enhanced liquidity
- Governance token with staking and fee distribution mechanisms
Economic Model:
- Total Supply: 1,000,000,000 DYDX
- Distribution: 50% to community, remainder to investors and foundation
- Inflation Cap: 2% annually, managed through governance
- Funding History: $87 million raised across four rounds, including $65 million Series C (June 2021)
Technical Specifications:
- Blockchain: Ethereum and dYdX Chain (Layer 1)
- Holders: 45,364
- Exchange Listings: 20
IV. Market Position and Competitive Comparison
Market Dominance and Scale
dYdX significantly outperforms LUMINT in terms of established market position, with a market cap approximately 2.8 times larger and a circulating supply ratio of 81.33% (indicating more mature tokenomics). dYdX ranks #278 globally while LUMINT ranks #461, reflecting the former's stronger institutional adoption and historical credibility.
Liquidity and Trading Activity
dYdX maintains nearly double the 24-hour trading volume ($732,822.67) compared to LUMINT ($375,262.03), indicating superior market liquidity. DYDX is listed on 20 exchanges versus LUMINT's 2 listings, providing significantly broader accessibility and market depth.
Risk Considerations
Both tokens demonstrate extreme volatility with severe year-over-year losses, indicating high-risk asset classifications. The Extreme Fear market sentiment (17/100) suggests elevated market uncertainty affecting both projects. LUMINT's concentrated holder base (2,145 addresses) presents greater liquidity concentration risk compared to dYdX's distributed holder network (45,364 addresses).
V. Key Observations
Important Disclaimer: This analysis is provided for informational purposes only and does not constitute investment advice. The extreme fear market sentiment, combined with both assets' significant historical losses, indicates heightened risk. Cryptocurrency markets remain highly volatile and unpredictable, potentially resulting in substantial financial losses.
Primary Findings:
-
Maturity Differential: dYdX represents a more established protocol with institutional backing and multi-year operational history, while LUMINT is a newer initiative requiring careful market validation.
-
Volatility Profiles: Both assets demonstrate extreme price volatility, with LUMINT showing compressed timeframe swings and dYdX exhibiting extended depreciation cycles.
-
Technical Differentiation: dYdX's Layer 2 scaling implementation and established ecosystem contrast with LUMINT's AI-integration focus and hybrid model approach.
-
Market Sentiment: Current extreme fear conditions warrant conservative positioning from all market participants regardless of individual asset selection.
-
Liquidity Risk: LUMINT's limited exchange listings and smaller holder base present concentration and exit liquidity challenges relative to dYdX's broader market distribution.
Data Current As Of: December 18, 2025, 11:11:48 UTC
Investment Value Analysis: LUMINT vs DYDX
I. Executive Summary
Based on available research materials, this report examines the investment value drivers for LUMINT and DYDX tokens. The analysis reveals that both assets are influenced by market demand, investor confidence, and technological innovation, with DYDX demonstrating growth momentum through its decentralized exchange innovations.
II. Core Factors Influencing LUMINT vs DYDX Investment Value
Supply Mechanism Comparison (Tokenomics)
The provided reference materials do not contain detailed tokenomics specifications for either LUMINT or DYDX, including information on supply caps, inflation schedules, or emission mechanisms. This section cannot be completed without access to verified on-chain data or official documentation.
Institutional Adoption and Market Application
Market Demand Factors:
- DYDX has demonstrated growth driven by its decentralized exchange innovation platform
- Both tokens' investment value is primarily influenced by market demand and investor confidence levels
- The reference materials indicate increasing focus on decentralized trading infrastructure
Enterprise Adoption:
- Specific enterprise adoption data for cross-border payments, settlements, or investment portfolio applications is not provided in the available materials
- Institutional positioning and comparative adoption rates cannot be determined from current sources
Regulatory Environment:
- Country-specific regulatory attitudes toward LUMINT and DYDX are not addressed in the provided materials
Technological Development and Ecosystem Building
DYDX Technical Progress:
- DYDX Chain has launched a test version on Android platforms, indicating ongoing platform expansion
- The ecosystem demonstrates active development in decentralized exchange infrastructure
Ecosystem Comparison:
- Detailed information on DeFi integration, NFT support, payment capabilities, and smart contract deployment for either token is not available in the provided materials
Macroeconomic Environment and Market Cycles
The provided reference materials do not contain analysis of inflation dynamics, monetary policy impacts, interest rate sensitivity, USD index correlation, or geopolitical factors affecting either asset.
Note: This report is limited by the scope and specificity of available reference materials. A comprehensive investment analysis would require additional verified data on tokenomics, regulatory frameworks, technical specifications, and macroeconomic correlations. No investment recommendations are provided.
III. 2025-2030 Price Forecast: LUMINT vs DYDX
Short-term Forecast (2025)
- LUMINT: Conservative $0.01584-$0.01909 | Optimistic $0.02614
- DYDX: Conservative $0.15801-$0.16990 | Optimistic $0.19369
Medium-term Forecast (2027-2028)
- LUMINT may enter accumulation phase, anticipated price range $0.01502-$0.03329
- DYDX may experience steady growth phase, anticipated price range $0.16976-$0.25257
- Key drivers: institutional capital inflows, ecosystem development, market adoption
Long-term Forecast (2029-2030)
- LUMINT: Base scenario $0.02902-$0.03087 | Optimistic scenario $0.04353-$0.04761
- DYDX: Base scenario $0.16546-$0.22980 | Optimistic scenario $0.30333-$0.37053
Disclaimer: This analysis is based on historical data and predictive models. Cryptocurrency markets are highly volatile and unpredictable. These forecasts do not constitute investment advice. Past performance does not guarantee future results. Investors should conduct their own research and consult with financial advisors before making investment decisions. Predictions may differ significantly from actual outcomes.
LUMINT:
| 年份 | 预测最高价 | 预测平均价格 | 预测最低价 | 涨跌幅 |
|---|---|---|---|---|
| 2025 | 0.02614371 | 0.019083 | 0.01583889 | -1 |
| 2026 | 0.03007576215 | 0.022613355 | 0.0176384169 | 16 |
| 2027 | 0.030559687947 | 0.026344558575 | 0.01501639838775 | 35 |
| 2028 | 0.03328898421537 | 0.028452123261 | 0.02361526230663 | 46 |
| 2029 | 0.04352748077084 | 0.030870553738185 | 0.029018320513893 | 58 |
| 2030 | 0.047614742085776 | 0.037199017254512 | 0.023435380870343 | 91 |
DYDX:
| 年份 | 预测最高价 | 预测平均价格 | 预测最低价 | 涨跌幅 |
|---|---|---|---|---|
| 2025 | 0.193686 | 0.1699 | 0.158007 | 0 |
| 2026 | 0.19633644 | 0.181793 | 0.17452128 | 7 |
| 2027 | 0.2249870168 | 0.18906472 | 0.1777208368 | 11 |
| 2028 | 0.252571559448 | 0.2070258684 | 0.169761212088 | 21 |
| 2029 | 0.30333430237968 | 0.229798713924 | 0.16545507402528 | 35 |
| 2030 | 0.370527446331057 | 0.26656650815184 | 0.258569512907284 | 56 |
Comparative Analysis Report: LUMINT vs dYdX
Investment Strategy and Risk Assessment
December 18, 2025
IV. Investment Strategy Comparison: LUMINT vs dYdX
Long-term vs Short-term Investment Strategies
LUMINT: Suitable for risk-tolerant investors seeking exposure to emerging AI-blockchain integration technologies. The project's early-stage positioning and recent short-term recovery momentum (7-day: +19.39%) may appeal to those with extended time horizons willing to endure extreme volatility for potential long-term appreciation through ecosystem maturation.
dYdX: Suitable for investors prioritizing established market infrastructure and institutional-grade trading infrastructure. The protocol's Layer 2 scaling integration, broader exchange listings (20 venues), and larger holder distribution appeal to those seeking relatively more stable exposure within the decentralized derivatives market segment.
Risk Management and Asset Allocation
Conservative Investors:
- LUMINT: 5-10% allocation (if any exposure desired)
- dYdX: 15-20% allocation
- Hedge Instruments: Primary positioning in stablecoins (60-70%), with derivative positions via options for downside protection
Aggressive Investors:
- LUMINT: 20-30% allocation for high-risk/high-reward exposure
- dYdX: 30-40% allocation for core decentralized derivatives market participation
- Hedge Instruments: Cross-collateral positioning, perpetual futures hedges, and volatility index (VIX) proxy strategies through multi-asset correlation
Risk Consideration: The Extreme Fear market sentiment (17/100) suggests both allocations warrant substantial stablecoin buffering regardless of investor risk profile.
V. Comparative Risk Analysis
Market Risk
LUMINT:
- Extreme volatility compression within narrow timeframes (92% peak-to-trough decline within 11 days)
- Limited liquidity depth with only 2 exchange listings creates potential exit liquidity constraints
- Concentrated holder base (2,145 addresses) presents acute price manipulation risk during large liquidation events
- Early-stage project status introduces adoption uncertainty and sustainability concerns
dYdX:
- Year-over-year depreciation of 91.23% indicates prolonged bearish pressure despite established market position
- Extended downtrend suggests potential capitulation risk or fundamental market headwinds
- Distributed holder base (45,364 addresses) provides superior liquidity relative to LUMINT but remains vulnerable to sector-wide sentiment shifts
- Regulatory uncertainty surrounding decentralized derivatives platforms in key jurisdictions
Technical Risk
LUMINT:
- Limited technical specification data available regarding scalability architecture and consensus mechanism robustness
- BEP-20 token standard on Binance Smart Chain introduces dependency on BSC network stability and security practices
- Unproven AI integration methodology and unclear technical differentiation from competing protocols
dYdX:
- Layer 2 scaling implementation via StarkEx introduces additional protocol layer complexity and potential settlement delays
- Order book concentration risk through central limit order book (CLOB) architecture during extreme volatility periods
- Smart contract security exposure through Ethereum mainnet interactions despite L2 isolation benefits
Regulatory Risk
The reference materials do not contain country-specific regulatory policy analysis or assessment of compliance frameworks affecting either asset's operational viability across major jurisdictions. Regulatory risk exposure cannot be comprehensively evaluated from available sources.
VI. Conclusion: Which Is the Better Buy?
📌 Investment Value Summary:
LUMINT Advantages:
- Recent technical recovery momentum across multiple short-term timeframes (+19.39% 7-day performance)
- Early-stage positioning offers potential asymmetric upside for risk-tolerant capital
- AI-blockchain hybrid model addresses emerging technology intersection with limited competitive saturation
- Lower absolute price point ($0.019155) facilitates retail participation
dYdX Advantages:
- Established market infrastructure with multi-year operational history and institutional recognition
- Superior liquidity profile (2.8x larger market cap, double 24-hour trading volume)
- Broader exchange accessibility (20 listings vs 2) reduces exit friction and slippage risk
- Decentralized derivatives market positioning captures structural DeFi trading volume expansion
- Larger and more distributed holder base (45,364 addresses) mitigates individual concentration risk
✅ Investment Recommendations:
Beginner Investors: Given the Extreme Fear market sentiment and both assets' severe historical losses, capital deployment should prioritize stablecoin positioning (70%+) with minimal tactical exposure. If seeking cryptocurrency allocation, dYdX's established infrastructure and superior liquidity present lower operational risk than LUMINT's concentrated liquidity and early-stage uncertainty.
Experienced Investors: dYdX-weighted allocation (60-70% of crypto exposure) paired with opportunistic LUMINT accumulation (if technical recovery confirms above $0.025 resistance) provides balanced risk-adjusted positioning. Implement strict stop-loss discipline at 20-25% below entry points given extreme volatility conditions.
Institutional Investors: dYdX represents the superior choice for institutional capital due to 20-venue exchange accessibility enabling efficient position sizing, sufficient on-chain liquidity for multi-million dollar transactions, and established governance frameworks. Avoid LUMINT until holder concentration normalizes and ecosystem traction becomes quantifiable through on-chain metrics.
⚠️ Risk Disclaimer: Cryptocurrency markets demonstrate extreme volatility and unpredictability. Both LUMINT and dYdX have experienced severe historical losses (72-96% from peaks), and current Extreme Fear sentiment conditions indicate heightened systemic risk. This analysis is provided for informational purposes only and does not constitute investment advice. Past performance does not guarantee future results. Investors must conduct independent research and consult qualified financial advisors before deployment of capital. Substantial financial loss remains possible regardless of asset selection.
Data Current As Of: December 18, 2025, 11:11:48 UTC None
FAQ: LUMINT vs dYdX Investment Comparison
I. What are the key differences between LUMINT and dYdX projects?
Answer: LUMINT is an emerging AI-blockchain hybrid protocol led by the Neural Trust Foundation, combining artificial intelligence with decentralized node staking and intelligent mining systems. dYdX is an established decentralized derivatives trading protocol (launched 2017) providing margin trading, spot trading, and perpetual futures contracts through Ethereum-based smart contracts and Layer 2 scaling infrastructure. The fundamental distinction lies in project maturity—dYdX has a multi-year operational history with institutional adoption, while LUMINT represents an early-stage initiative requiring market validation.
II. Which token demonstrates better price stability and lower volatility?
Answer: dYdX exhibits more consistent downward pressure across all timeframes (1-year: -91.23%) but displays gradual, predictable depreciation patterns. LUMINT shows extreme compression volatility, with a 92% peak-to-trough decline within 11 days (November 19-30, 2025), followed by recent recovery momentum (+19.39% over 7 days). Neither asset qualifies as "stable"—both remain high-volatility instruments. dYdX's distributed price action may present marginally better technical predictability, while LUMINT's volatility creates both severe downside and potential recovery swing risks.
III. What are the liquidity and accessibility differences between these tokens?
Answer: dYdX significantly outperforms in liquidity metrics: 20 exchange listings versus LUMINT's 2 listings, 2.8x larger market capitalization ($162.8M vs $57.5M), and nearly double the 24-hour trading volume ($732,823 vs $375,262). dYdX's larger holder distribution (45,364 addresses) versus LUMINT's concentrated base (2,145 addresses) indicates superior market depth. For investors prioritizing exit liquidity and trading accessibility, dYdX provides substantially lower slippage risk and greater operational flexibility across multiple trading venues.
IV. Which asset is more suitable for conservative investors?
Answer: dYdX is the more appropriate choice for conservative investors, though both tokens carry extreme risk classifications given current market conditions (Extreme Fear sentiment: 17/100). dYdX's advantages include institutional-grade infrastructure, established market recognition, broader exchange accessibility, and distributed holder base reducing concentration risk. Conservative allocation recommendations suggest dYdX exposure of 15-20% within cryptocurrency allocations, paired with 60-70% stablecoin positioning. LUMINT should represent maximum 5-10% exposure for conservative portfolios, if included at all, due to liquidity concentration risk and unproven ecosystem maturation.
V. What do the price forecasts suggest for 2025-2030 performance?
Answer: LUMINT forecasts indicate gradual appreciation potential, with 2030 predictions ranging from $0.02343-$0.04761 (base to optimistic scenarios), representing potential 58-91% gains from current $0.019155 levels. dYdX forecasts suggest more modest appreciation, with 2030 projections of $0.25857-$0.37053, representing 35-56% gains from current $0.1699 levels. Both forecasts assume continued market development and institutional capital inflows. Importantly, these predictions carry substantial uncertainty given cryptocurrency market volatility and represent probabilistic scenarios rather than guaranteed outcomes. Historical accuracy of such forecasts remains limited.
VI. How do tokenomics and supply mechanisms compare between the two assets?
Answer: dYdX operates under defined tokenomics: 1 billion total supply with 50% community distribution, 2% annual inflation cap managed through governance, and approximately 813.3M circulating supply (81.33% circulated). LUMINT maintains a fixed 3 billion token supply with 100% already in circulation, eliminating inflation concerns but creating higher total supply dilution. dYdX's governance-managed inflation and distributed supply mechanism provide superior long-term value preservation potential compared to LUMINT's fully-circulated supply model. Neither asset displays deflationary mechanics through token burning or buyback programs based on available documentation.
VII. What risk factors should investors prioritize when evaluating these tokens?
Answer: Critical risk considerations include: (1) Extreme market sentiment (Fear Index: 17/100) affecting both assets; (2) LUMINT's concentrated holder base (2,145 addresses) presenting acute manipulation and exit liquidity risk; (3) dYdX's 91% year-over-year depreciation indicating sustained bearish pressure; (4) LUMINT's limited exchange accessibility reducing trading flexibility; (5) regulatory uncertainty surrounding decentralized derivatives platforms; (6) LUMINT's unproven AI integration methodology and technical differentiation; (7) both tokens' severe historical losses (72-96% from peaks) indicating substantial downside has already materialized. Conservative risk management requires substantial stablecoin buffering regardless of asset selection.
VIII. For which investor profiles is LUMINT preferable despite its higher risk profile?
Answer: LUMINT suits exclusively risk-tolerant investors with extended time horizons (3+ years) seeking asymmetric upside exposure to emerging AI-blockchain technology convergence. This profile typically includes: (1) Venture capital-oriented individuals comfortable with total loss scenarios; (2) Technologists prioritizing protocol innovation over established track records; (3) Contrarian investors exploiting extreme fear sentiment for deep value positioning; (4) Portfolio diversification seekers adding uncorrelated early-stage asset exposure. Recent recovery momentum (+19.39% 7-day performance) appeals primarily to technical traders executing swing-trading strategies rather than buy-and-hold investors. Beginner and conservative investors should avoid LUMINT entirely given liquidity concentration risk and sustainability concerns.
⚠️ Critical Disclaimer: This FAQ analysis is provided for informational purposes only and does not constitute investment advice. Cryptocurrency markets remain highly volatile and unpredictable, potentially resulting in substantial financial losses. Past performance does not guarantee future results. Investors must conduct independent research and consult qualified financial advisors before capital deployment. The extreme fear market sentiment combined with both assets' severe historical losses indicates heightened systemic risk warranting conservative positioning.
Data Current As Of: December 18, 2025
Share
How to Buy Cryptocurrency


Trending Cryptocurrencies


XZXX: A Comprehensive Guide to the BRC-20 Meme Token in 2025

Bitcoin Fear and Greed Index: Market Sentiment Analysis for 2025
Top Crypto ETFs to Watch in 2025: Navigating the Digital Asset Boom

5 ways to get Bitcoin for free in 2025: Newbie Guide

Bitcoin Market Cap in 2025: Analysis and Trends for Investors

2025 Bitcoin Price Prediction: Trump's Tariffs' Impact on BTC
Understanding Digital Ledgers: The Backbone of Blockchain Technology

Effortless Ethereum Bridging to Arbitrum: A Web3 User's Handbook

Exploring Kamino Finance: A Solana-Based Liquidity Management Solution
What is LAVA: A Comprehensive Guide to Large-scale Autonomous Vehicle Architecture

Top Emerging NFT Projects to Follow in 2023