Is Deri Protocol (DERI) a good investment?: A Comprehensive Analysis of Tokenomics, Use Cases, and Market Potential in 2024

Introduction: Deri Protocol (DERI) Investment Position and Market Prospects
DERI is an important asset in the cryptocurrency field. Since its launch in February 2021, it has achieved significant progress in decentralized derivatives trading. As of December 30, 2025, DERI maintains a fully diluted market capitalization of approximately USD 1,281,936.84, with a circulating supply of approximately 131.19 million tokens and a current price hovering around USD 0.002739. Positioned as a "decentralized protocol for accurate and capital-efficient risk exposure trading," DERI has gradually become a focal point when investors discuss "Is Deri Protocol (DERI) a good investment?" The protocol operates on a governance model where major decisions regarding the agreement and token economics are determined through voting by DERI token holders, reflecting the decentralized ownership structure common in DeFi projects. This comprehensive analysis will examine DERI's investment value, historical price performance, future price projections, and associated investment risks to provide reference guidance for investors.
Deri Protocol (DERI) Market Analysis Report
I. Price History Review and Current Investment Status
Historical Price Performance and Investment Returns
Based on available data, the following key price points have been recorded:
- February 2021: All-time high of $3.77 reached (ATH Date: February 13, 2021)
- September 2025: All-time low of $0.00200107 reached (ATL Date: September 1, 2025)
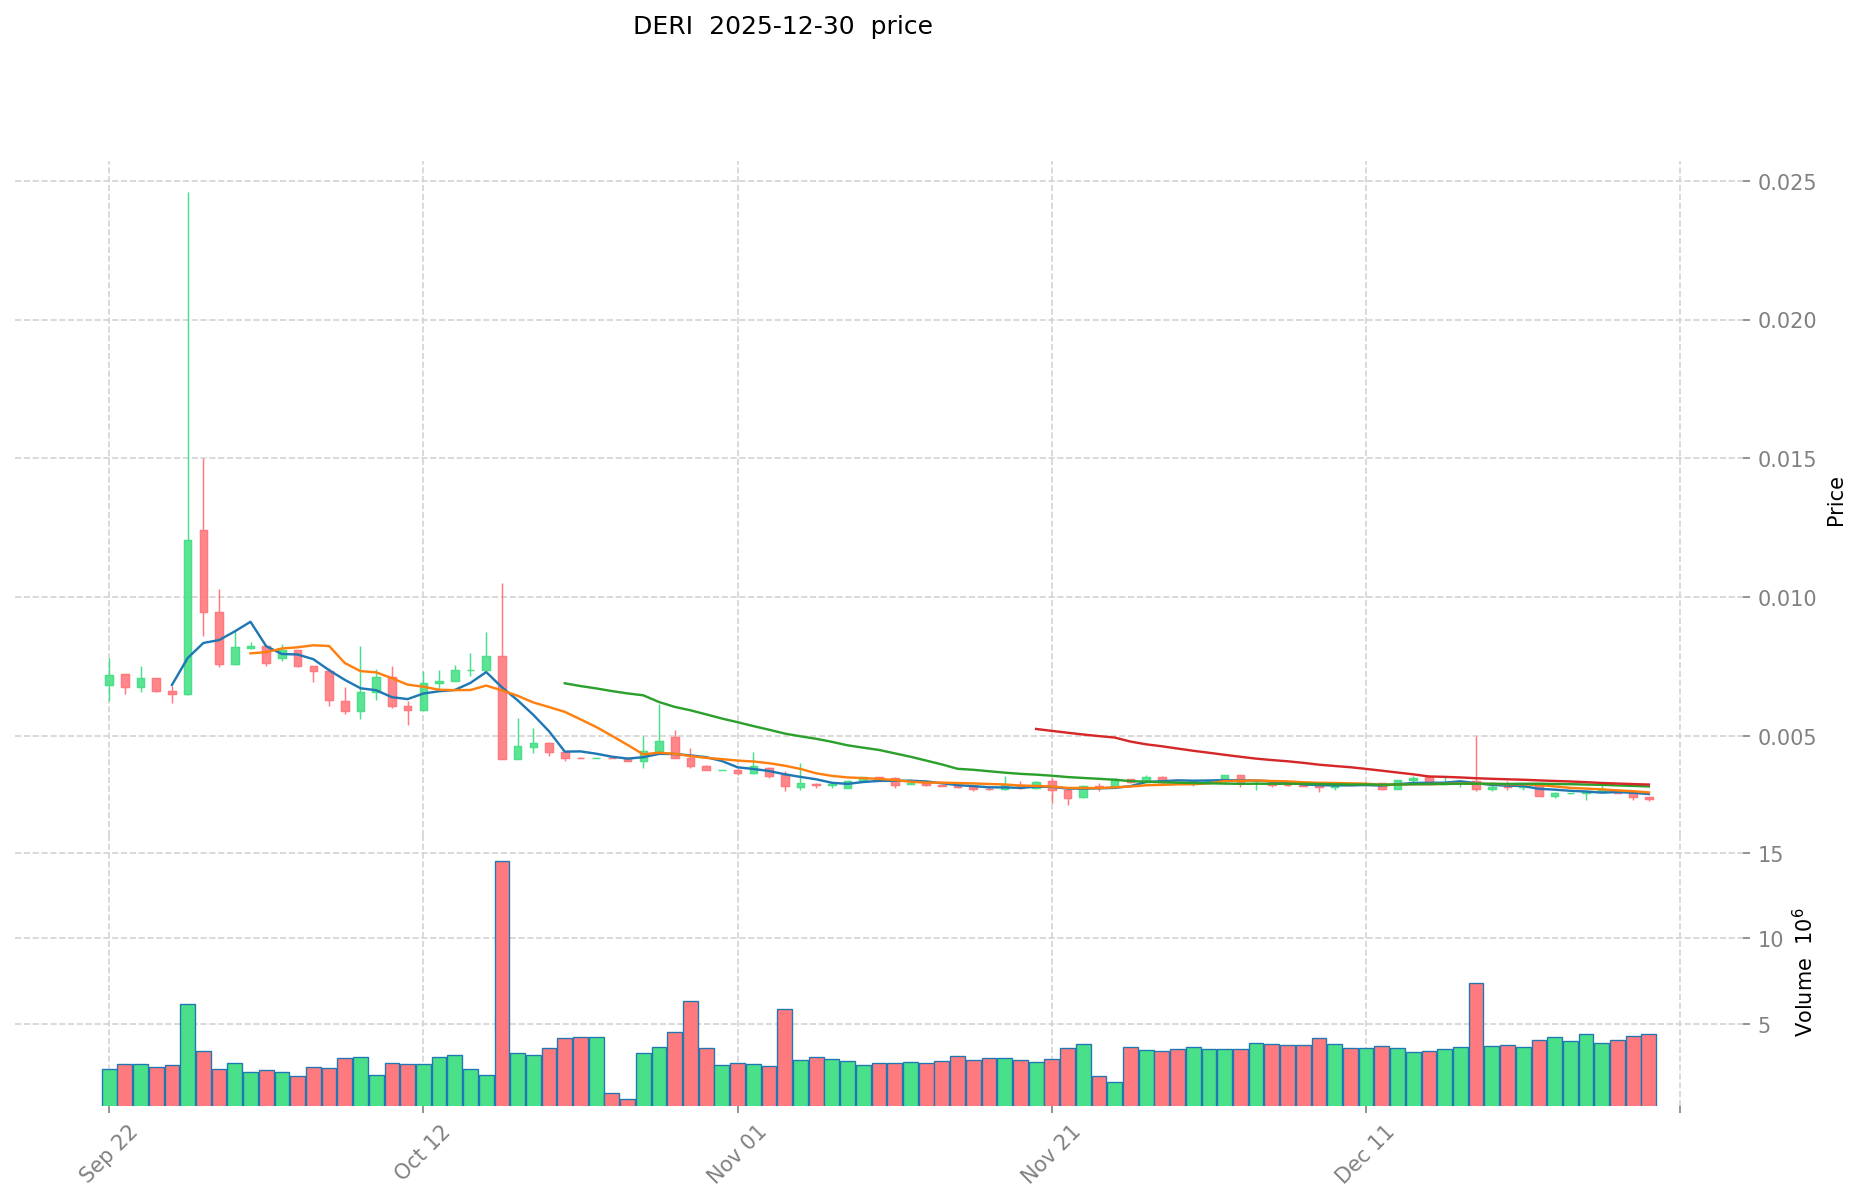
- December 30, 2025: Current trading price of $0.002739
This represents a decline of approximately 88.71% over the past 12 months from the current price perspective.
Current Market Status (December 30, 2025)
- Current DERI Price: $0.002739
- Market Sentiment: Positive (Sentiment Score: 1)
- 24-Hour Trading Volume: $12,006.55
- 1-Hour Price Change: -0.11%
- 7-Day Price Change: -5.68%
- 30-Day Price Change: -18.08%
- 52-Week Price Change: -88.71%
Real-time DERI market price available at Gate
II. Project Overview
Deri Protocol is a decentralized protocol designed to enable users to trade risk exposure with high precision and capital efficiency. The protocol leverages community governance through its native token, DERI, which serves as both a governance mechanism and a privilege token within the ecosystem.
Key Characteristics
- Governance Model: Community-driven through DERI token voting
- Token Utility: DERI holders receive privileges during protocol participation
- Development: Designed and developed by DeFi Factory, a team comprising financial experts, mathematicians, and computer scientists
- Team Expertise: Core members hold advanced degrees and possess extensive derivatives experience from Wall Street operations
III. Tokenomics and Supply Metrics
Token Distribution
| Metric | Value |
|---|---|
| Current Price | $0.002739 |
| Circulating Supply | 131,192,006.31 DERI |
| Total Supply | 468,030,976.40 DERI |
| Maximum Supply | Unlimited |
| Circulation Ratio | 27.36% |
| Market Capitalization | $359,334.91 |
| Fully Diluted Valuation | $1,281,936.84 |
| Market Dominance | 0.000040% |
Supply Analysis
The circulating supply represents approximately 27.36% of the total supply, with an unlimited maximum supply cap indicated for the protocol.
IV. Market Data and Technical Metrics
Trading Activity
- 24-Hour High: $0.002739
- 24-Hour Low: $0.002667
- Number of Holders: 991
- Active Exchange Listings: 1
Price Trend Analysis
| Time Period | Price Change | Change Amount |
|---|---|---|
| 1 Hour | -0.11% | -$0.000003 |
| 24 Hours | +0.33% | +$0.000009 |
| 7 Days | -5.68% | -$0.000165 |
| 30 Days | -18.08% | -$0.000605 |
| 1 Year | -88.71% | -$0.021521 |
V. Blockchain Presence
Multi-Chain Deployment
| Network | Contract Address | Status |
|---|---|---|
| Ethereum (ETH) | 0xa487bf43cf3b10dffc97a9a744cbb7036965d3b9 | Active |
| Binance Smart Chain (BSC) | 0xe60eaf5a997dfae83739e035b005a33afdcc6df5 | Active |
Official Resources
- Official Website: https://deri.io/
- Twitter: https://twitter.com/DeriProtocol
- Explorer Links: Available on Etherscan and BSCscan
VI. Investment Considerations
Notable Observations
- Market Position: DERI ranks at position 3,537 by market capitalization
- Liquidity: Daily trading volume of approximately $12,006.55 indicates moderate liquidity
- Token Holder Base: 991 holders suggest a concentrated distribution
- Historical Volatility: Significant price decline from all-time high reflects market challenges in the derivatives DeFi sector
- Governance Structure: Community ownership model aligns with DeFi principles, though decision-making effectiveness depends on holder participation
Disclaimers
This report is based solely on factual market data and project information provided. No investment recommendations, financial advice, or price predictions are offered. Cryptocurrency investments carry substantial risk and volatility. Investors should conduct independent research and consult with financial professionals before making investment decisions.
Deri Protocol (DERI) Investment Analysis Report
Report Date: December 30, 2025
I. Executive Summary
Deri Protocol is a decentralized protocol enabling users to trade risk exposure with high capital efficiency and precision. As of December 30, 2025, DERI is trading at $0.002739, representing a significant decline of 88.71% over the past year from its all-time high of $3.77 reached in February 2021. The token has a circulating supply of 131.19 million DERI against a total supply of 468.03 million, with a market capitalization of approximately $359,334.91 and a fully diluted valuation of $1,281,936.84.
II. Core Factors Influencing Whether Deri Protocol (DERI) is a Good Investment
Supply Mechanism and Scarcity
- Token Distribution: Deri Protocol has a total supply of 468,030,976.41 DERI tokens with unlimited maximum supply (∞), indicating no hard cap on token issuance.
- Circulating Supply: Currently 131,192,006.31 DERI tokens are in circulation, representing 27.36% of total supply.
- Investment Implication: The unlimited maximum supply structure presents potential dilution concerns for long-term token holders, as the protocol retains the ability to increase token circulation indefinitely.
Governance and Protocol Economics
- Decentralized Governance: Community ownership and protocol management are based on DERI token voting rights, with major decisions regarding protocol and token economics determined through democratic voting processes.
- Token Privileges: DERI holders receive special privileges within the ecosystem, including benefits during DERI trading operations.
- Investment Consideration: Governance participation potential provides utility beyond speculative trading, though voting power concentration remains a consideration.
Development Team and Expertise
- Team Composition: Deri Protocol was designed and developed by DeFi Factory, a team comprising experts in finance, mathematics, and computer science.
- Technical Expertise: Core team members hold doctoral degrees in relevant fields and possess extensive experience in derivatives business from Wall Street.
- Domain Knowledge: The team demonstrates years of experience in derivative pricing, trading, structural design, cryptocurrency trading, and Solidity programming.
Market Position and Adoption
- Market Ranking: DERI ranks 3,537 by market capitalization as of December 30, 2025.
- Market Share: Represents 0.000040% of total cryptocurrency market capitalization.
- Trading Activity: 24-hour trading volume stands at 12,006.55 DERI, with 991 token holders recorded.
- Cross-Chain Deployment: DERI is deployed on both Ethereum (ETH) and Binance Smart Chain (BSC) networks, indicating multi-chain adoption strategy.
III. Price Performance and Market Sentiment
Historical Price Trends
| Time Period | Change Percentage | Price Movement |
|---|---|---|
| 1 Hour | -0.11% | -$0.000003 |
| 24 Hours | +0.33% | +$0.000009 |
| 7 Days | -5.68% | -$0.000165 |
| 30 Days | -18.08% | -$0.000605 |
| 1 Year | -88.71% | -$0.021521 |
- All-Time High: $3.77 (February 13, 2021)
- All-Time Low: $0.00200107 (September 1, 2025)
- Current Price Range (24H): $0.002667 to $0.002739
Current Market Condition
- Price Level: Trading near all-time low levels, suggesting severe market pessimism.
- Long-Term Decline: Year-over-year decline of 88.71% indicates significant investor disinterest and value erosion.
IV. Investment Outlook and Forecasts
Mixed Analytical Perspectives
Market forecasts for DERI present divergent views:
- Bullish Scenarios: Some forecasting models suggest potential year-end 2025 prices ranging from $0.7187 to $1.00, implying potential appreciation from current levels.
- Bearish Scenarios: Multiple technical indicators point to bearish sentiment, with concerns about weak near-term performance potential.
- Neutral Assessment: Cryptocurrency investments in this category are characterized as speculative, requiring careful risk evaluation from individual investors.
Risk Factors
- Technical Sentiment: Various technical analysis indicators present mixed signals, with some pointing to bearish conditions despite occasional bullish technical readings.
- Market Liquidity: Limited trading volume (12,006.55 DERI in 24 hours) suggests potential liquidity constraints for significant position entry or exit.
- Holder Concentration: With only 991 token holders, potential concentration risk exists regarding price stability and market manipulation.
V. Protocol Functionality and Use Case
Deri Protocol operates as a decentralized derivative exchange solution, offering users the ability to:
- Trade derivative risk exposure with capital efficiency
- Access decentralized alternatives to traditional derivative markets
- Participate in DeFi-native financial derivative instruments
The protocol integrates fundamental DeFi characteristics with financial derivative market features, positioning itself within the specialized DeFi derivative trading segment.
VI. Key Resources and On-Chain Information
- Official Website: https://deri.io/
- Twitter: https://twitter.com/DeriProtocol
- Ethereum Contract: 0xa487bf43cf3b10dffc97a9a744cbb7036965d3b9
- BSC Contract: 0xe60eaf5a997dfae83739e035b005a33afdcc6df5
VII. Conclusion
Deri Protocol presents a specialized investment case within the DeFi derivatives segment. The protocol benefits from experienced development team expertise in both traditional finance and cryptocurrency. However, significant headwinds exist, including substantial year-over-year depreciation, unlimited token supply structure, limited market liquidity, and mixed technical forecasts. Prospective investors should conduct comprehensive due diligence considering their individual risk tolerance, investment horizon, and portfolio allocation constraints.
III. DERI Future Investment Predictions and Price Outlook (Is Deri Protocol(DERI) worth investing in 2025-2030)
Short-term Investment Forecast (2025, short-term DERI investment outlook)
- Conservative Forecast: $0.00235 - $0.00280
- Neutral Forecast: $0.00274 - $0.00338
- Optimistic Forecast: $0.00338 - $0.00380
Mid-term Investment Perspective (2026-2028, mid-term Deri Protocol(DERI) investment forecast)
- Market Stage Expectation: Consolidation phase with gradual protocol adoption and ecosystem expansion in decentralized derivatives trading
- Investment Return Forecast:
- 2026: $0.00222 - $0.00409 (19% potential upside)
- 2027: $0.00276 - $0.00452 (34% potential upside)
- 2028: $0.00262 - $0.00422 (49% potential upside)
- Key Catalysts: Enhanced derivatives protocol functionality, expanded market adoption, improved capital efficiency mechanisms, and integration with additional blockchain networks
Long-term Investment Outlook (Is Deri Protocol a good long-term investment?)
- Base Case Scenario: $0.00292 - $0.00623 (Steady protocol adoption and mainstream DeFi derivatives integration)
- Optimistic Scenario: $0.00623 - $0.00787 (Significant institutional adoption and protocol breakthroughs)
- Risk Scenario: $0.00150 - $0.00232 (Market contraction and reduced derivatives demand)
Click to view DERI long-term investment and price predictions: Price Prediction
2025-12-31 to 2030-12-31 Long-term Outlook
- Base Case Scenario: $0.00292 - $0.00500 USD (corresponding to steady protocol growth and stable derivatives trading volume)
- Optimistic Scenario: $0.00500 - $0.00623 USD (corresponding to large-scale adoption and favorable market conditions)
- Transformative Scenario: $0.00623 USD and above (if ecosystem achieves breakthrough progress and mainstream adoption)
- 2030-12-31 Predicted High: $0.00623 USD (based on optimistic development assumptions)
Disclaimer: This analysis is based on available market data and historical trends. Price forecasts are subject to significant uncertainty and should not be considered as financial advice. Cryptocurrency markets remain highly volatile. Investors should conduct independent research before making investment decisions.
| 年份 | 预测最高价 | 预测平均价格 | 预测最低价 | 涨跌幅 |
|---|---|---|---|---|
| 2025 | 0.00380304 | 0.002736 | 0.00235296 | 0 |
| 2026 | 0.0040869 | 0.00326952 | 0.0022232736 | 19 |
| 2027 | 0.0045241983 | 0.00367821 | 0.0027586575 | 34 |
| 2028 | 0.0042242402745 | 0.00410120415 | 0.002624770656 | 49 |
| 2029 | 0.005578047764415 | 0.00416272221225 | 0.002580887771595 | 51 |
| 2030 | 0.006234092785065 | 0.004870384988332 | 0.002922230992999 | 77 |
Deri Protocol (DERI) Investment Analysis Report
I. Project Overview
Project Introduction
Deri Protocol is a decentralized protocol that enables users to trade risk exposure with high capital efficiency and precision. As a DeFi project, the protocol incorporates community ownership and governance mechanisms based on the protocol token DERI. Major decisions regarding protocol development and tokenomics are determined through DERI token voting.
DERI functions as a privilege token within the ecosystem. Token holders receive specific privileges during DERI trading activities. The protocol was designed and developed by DeFi Factory, a team composed of financial, mathematics, and computer science experts. Core team members hold doctoral degrees and possess extensive experience in Wall Street derivatives trading. The team brings specialized expertise in derivatives pricing, trading, and structuring, with several years of experience in cryptocurrency trading and Solidity programming.
Token Metrics (As of December 30, 2025)
| Metric | Value |
|---|---|
| Current Price | $0.002739 |
| 24H Change | +0.33% |
| Market Capitalization | $359,334.91 |
| Fully Diluted Valuation (FDV) | $1,281,936.84 |
| Circulating Supply | 131,192,006.31 DERI |
| Total Supply | 468,030,976.40 DERI |
| Maximum Supply | Unlimited (∞) |
| Market Ranking | #3537 |
| 24H Trading Volume | $12,006.55 |
| Circulating Supply Ratio | 27.36% |
Price Performance Analysis
| Timeframe | Change |
|---|---|
| 1 Hour | -0.11% |
| 24 Hours | +0.33% |
| 7 Days | -5.68% |
| 30 Days | -18.08% |
| 1 Year | -88.71% |
Historical Price Extremes:
- All-Time High: $3.77 (February 13, 2021)
- All-Time Low: $0.00200107 (September 1, 2025)
- Current Price vs ATH: -99.93% decline
II. Network Distribution & Accessibility
Blockchain Networks
DERI token is deployed across multiple blockchain networks:
-
Ethereum (ETH)
- Contract Address: 0xa487bf43cf3b10dffc97a9a744cbb7036965d3b9
- Explorer: Etherscan
-
Binance Smart Chain (BSC)
- Contract Address: 0xe60eaf5a997dfae83739e035b005a33afdcc6df5
- Explorer: BscScan
Official Resources
- Website: https://deri.io/
- Twitter: https://twitter.com/DeriProtocol
- Token Holders: 991 addresses
III. Market Position & Characteristics
Key Observations
- Market Capitalization Ratio: Circulating market cap represents 27.36% of fully diluted valuation, indicating significant dilution risk from future token supply increases.
- Extreme Price Decline: The token has experienced a -88.71% loss over the past year and -99.93% from its all-time high, reflecting substantial market downturn.
- Low Trading Volume: The 24-hour trading volume of $12,006.55 is relatively low, suggesting limited liquidity.
- Unlimited Supply: The absence of a maximum supply cap creates indefinite inflation potential.
- Limited Holder Base: With only 991 token holders, the distribution appears relatively concentrated.
IV. Investment Strategy & Risk Management
Investment Methodology
Long-term Hold (HODL DERI): Suitable for risk-tolerant investors who believe in the long-term viability of decentralized derivatives trading infrastructure. This approach requires conviction in the protocol's fundamental value proposition and ecosystem adoption.
Active Trading: Dependent on technical analysis and momentum trading strategies. Given the high volatility and low liquidity, this approach carries elevated execution risks and slippage concerns.
Risk Management Framework
Asset Allocation Proportions:
- Conservative Investors: Less than 0.5% of portfolio allocation, if any
- Aggressive Investors: 1-2% of speculative allocation, with strict stop-loss discipline
- Professional Investors: Portfolio weighting should reflect position-specific risk assessment and hedging strategies
Risk Mitigation Strategies:
- Multi-asset portfolio diversification to reduce single-asset concentration risk
- Implementation of hedging instruments such as stablecoins or inverse positions
- Dollar-cost averaging to reduce timing risk on entry positions
Secure Storage Recommendations:
- Hot wallets: MetaMask, Trust Wallet for active trading (limit exposure)
- Cold Storage: Hardware wallets (Ledger, Trezor) for long-term holdings
- Institutional-grade custody solutions for significant positions
V. Investment Risks & Challenges
Market Risk
- High Volatility: The token exhibits extreme price fluctuations, with -99.93% decline from ATH. Short-term price movements are subject to significant manipulation potential given low trading volume.
- Liquidity Risk: Trading volume of $12,006.55 is insufficient for large position accumulation without material price impact.
- Price Discovery Inefficiency: Limited trading activity may result in inaccurate market valuation.
Regulatory Risk
- Policy Uncertainty: Cryptocurrency regulations vary significantly across jurisdictions. Changes in DeFi regulatory frameworks could materially impact protocol viability and token utility.
- Derivatives Regulation: Decentralized derivatives protocols face particular scrutiny from financial regulators globally.
Technical Risk
- Smart Contract Vulnerabilities: DeFi protocols face ongoing security audit requirements. Any protocol-level vulnerabilities could result in user fund loss.
- Network Risk: Protocol dependency on Ethereum and BSC networks subjects DERI to layer-1 network risks and congestion.
Tokenomics Risk
- Unlimited Supply: The absence of maximum supply creates indefinite inflationary pressure and dilution potential for token holders.
- Significant Supply Dilution: Circulating supply represents only 27.36% of total supply, indicating substantial future dilution from vesting schedules or emissions.
VI. Conclusion: Is DERI a Good Investment?
Investment Value Summary
Deri Protocol addresses a genuine market need for decentralized derivatives trading infrastructure. The project's experienced team brings valuable Wall Street expertise to decentralized finance.
However, the token faces severe headwinds:
- Catastrophic -88.71% one-year decline and -99.93% decline from all-time high
- Extremely low liquidity and trading volume
- Unlimited token supply creating indefinite dilution
- Concentrated holder base (991 addresses)
- Limited evidence of ecosystem adoption or trading volume metrics
Investor Recommendations
✅ Beginners: Not recommended. If exposure is desired, consider minimal allocation (< 0.1% of portfolio) using dollar-cost averaging entry strategy with hardware wallet storage.
✅ Experienced Traders: Position sizing strictly limited to 1-2% of speculative allocation. Implement rigorous technical analysis and strict stop-loss discipline. Consider this a high-risk/high-reward speculation rather than core portfolio holding.
✅ Institutional Investors: Conduct comprehensive protocol analysis including smart contract audits, team background verification, and derivative protocol competitive positioning before any allocation consideration.
Critical Disclaimer
⚠️ Important Notice: Cryptocurrency investment carries substantial risk, including potential total loss of capital. Deri Protocol's extreme price decline, low liquidity, unlimited supply, and uncertain adoption trajectory present significant hazard. This analysis is provided for informational purposes only and does not constitute investment advice, financial recommendation, or endorsement. Investors must conduct independent research and consult qualified financial advisors before making investment decisions. Past performance does not guarantee future results.
Report Generated: December 30, 2025 Data Source: Market data as of December 30, 2025 22:19:39 UTC
Deri Protocol (DERI) FAQ - Investment Analysis
I. FAQ
Q1: What is Deri Protocol (DERI) and what problem does it solve?
A: Deri Protocol is a decentralized protocol designed to enable users to trade risk exposure with high capital efficiency and precision. It addresses the market need for decentralized derivatives trading infrastructure, allowing participants to access DeFi-native financial derivative instruments without relying on centralized exchanges. The protocol was developed by DeFi Factory, a team composed of financial experts, mathematicians, and computer scientists with extensive Wall Street derivatives experience.
Q2: What is the current price of DERI and how has it performed historically?
A: As of December 30, 2025, DERI is trading at $0.002739 with a market capitalization of $359,334.91. Historically, the token reached an all-time high of $3.77 in February 2021 but has since declined 99.93% from that peak. Over the past 12 months, DERI has experienced an 88.71% price decline, with the all-time low of $0.00200107 reached on September 1, 2025. Current 24-hour trading volume stands at $12,006.55.
Q3: What are the tokenomics and supply mechanics of DERI?
A: DERI has a circulating supply of 131.19 million tokens (27.36% of total supply) against a total supply of 468.03 million tokens. Notably, the protocol features an unlimited maximum supply (∞), meaning there is no hard cap on token issuance. This unlimited supply structure creates potential dilution concerns for long-term token holders, as the protocol retains the ability to increase token circulation indefinitely. The fully diluted valuation stands at $1,281,936.84.
Q4: How does DERI governance work and what privileges do token holders receive?
A: DERI operates under a decentralized governance model where major protocol decisions and tokenomics changes are determined through voting by DERI token holders. Token holders possess governance rights and receive specific privileges within the ecosystem during DERI trading activities. This community-ownership structure aligns with DeFi principles, though decision-making effectiveness depends on active holder participation and voting engagement.
Q5: What are the primary investment risks associated with DERI?
A: Key investment risks include: (1) Extreme volatility with 88.71% decline over 12 months; (2) Very low liquidity with only $12,006.55 daily trading volume, creating execution risk for larger positions; (3) Unlimited token supply generating indefinite inflationary pressure; (4) Concentrated holder base of only 991 addresses; (5) Regulatory uncertainty surrounding decentralized derivatives protocols; (6) Smart contract vulnerability risks inherent to DeFi protocols; (7) Lack of clear evidence of significant ecosystem adoption or trading volume metrics.
Q6: What are the price predictions for DERI through 2030?
A: Price forecasts present mixed scenarios. Near-term 2025 projections range from $0.00235 (conservative) to $0.00380 (optimistic). Mid-term forecasts for 2026-2028 suggest potential returns of 19-49% under neutral conditions. Long-term 2030 projections indicate: Base Case $0.00292-$0.00500, Optimistic Scenario $0.00500-$0.00623, and Transformative Scenario exceeding $0.00623. However, these forecasts carry significant uncertainty and should not be considered financial advice.
Q7: Is DERI a good investment for different investor types?
A: For Beginners: Not recommended; if exposure is desired, consider less than 0.1% portfolio allocation using dollar-cost averaging. For Experienced Traders: Limit allocation to 1-2% of speculative funds with strict stop-loss discipline. For Institutional Investors: Conduct comprehensive protocol analysis including smart contract audits and competitive positioning assessment before consideration. All investors should recognize this as high-risk speculation rather than core portfolio holding given the extreme price decline and limited adoption evidence.
Q8: On which blockchain networks can DERI be accessed and traded?
A: DERI is deployed across two major blockchain networks: Ethereum (ETH) with contract address 0xa487bf43cf3b10dffc97a9a744cbb7036965d3b9, and Binance Smart Chain (BSC) with contract address 0xe60eaf5a997dfae83739e035b005a33afdcc6df5. The multi-chain deployment strategy enables broader ecosystem integration, though both networks carry their respective technical and operational risks. Official resources include the protocol website at https://deri.io/ and Twitter at https://twitter.com/DeriProtocol.
Important Disclaimer: Cryptocurrency investment carries substantial risk, including potential total loss of capital. This FAQ is provided for informational purposes only and does not constitute investment advice, financial recommendation, or endorsement. Investors must conduct independent research and consult qualified financial advisors before making investment decisions. Past performance does not guarantee future results. Deri Protocol's extreme price decline, low liquidity, unlimited supply, and uncertain adoption trajectory present significant investment hazards.
Share
How to Buy Cryptocurrency


Trending Cryptocurrencies


Is Perpetual Protocol (PERP) a Good Investment?: A Comprehensive Analysis of Its Long-term Potential in the DeFi Derivatives Market

Is NASDEX (NSDX) a good investment?: Analyzing the potential of this decentralized derivatives exchange token

What Do Derivatives Market Signals Reveal About MYX's 20% Pullback Risk?

KCT vs GMX: The Battle of Cryptocurrency Trading Platforms Heats Up

What Are the Key Signals from Crypto Derivatives Markets in 2025?

How Will Derivatives Market Signals Impact HBAR's Price in 2025?

How to Stake Chainlink: A Step-by-Step Guide to LINK Staking

AlphaArena Model Launch: How AI is Redefining Crypto Trading with Real-World Benchmarks

How to Participate in Chainlink Airdrop

SpaceX Transfers $105 Million in Bitcoin to Unmarked Wallets

Why Do We Celebrate Bitcoin Pizza Day?