CSPR vs NEAR: A Comprehensive Comparison of Two Leading Blockchain Platforms


Introduction: CSPR vs NEAR Investment Comparison
In the cryptocurrency market, comparisons between Casper and NEAR have always been a topic investors cannot overlook. The two not only show significant differences in market cap ranking, application scenarios, and price performance, but also represent different positioning in crypto assets. Casper (CSPR): Since its mainnet launch in March 2021, it has gained market recognition by focusing on bringing real-world assets on-chain through its Proof-of-Stake Layer-1 infrastructure and innovative multi-virtual machine architecture. NEAR (NEAR): Since its launch in October 2020, it has been recognized as a highly scalable protocol designed to support decentralized applications efficiently, particularly on mobile devices through state sharding technology. This article will provide a comprehensive analysis of the investment value comparison between CSPR and NEAR across historical price trends, supply mechanisms, technical ecosystems and future outlook, while attempting to answer the question that concerns investors the most:
"Which is the better buy right now?"
Comparative Analysis of Casper (CSPR) and NEAR Protocol: Market Performance and Technical Architecture
I. Historical Price Comparison and Current Market Status
Price Trajectory of CSPR and NEAR
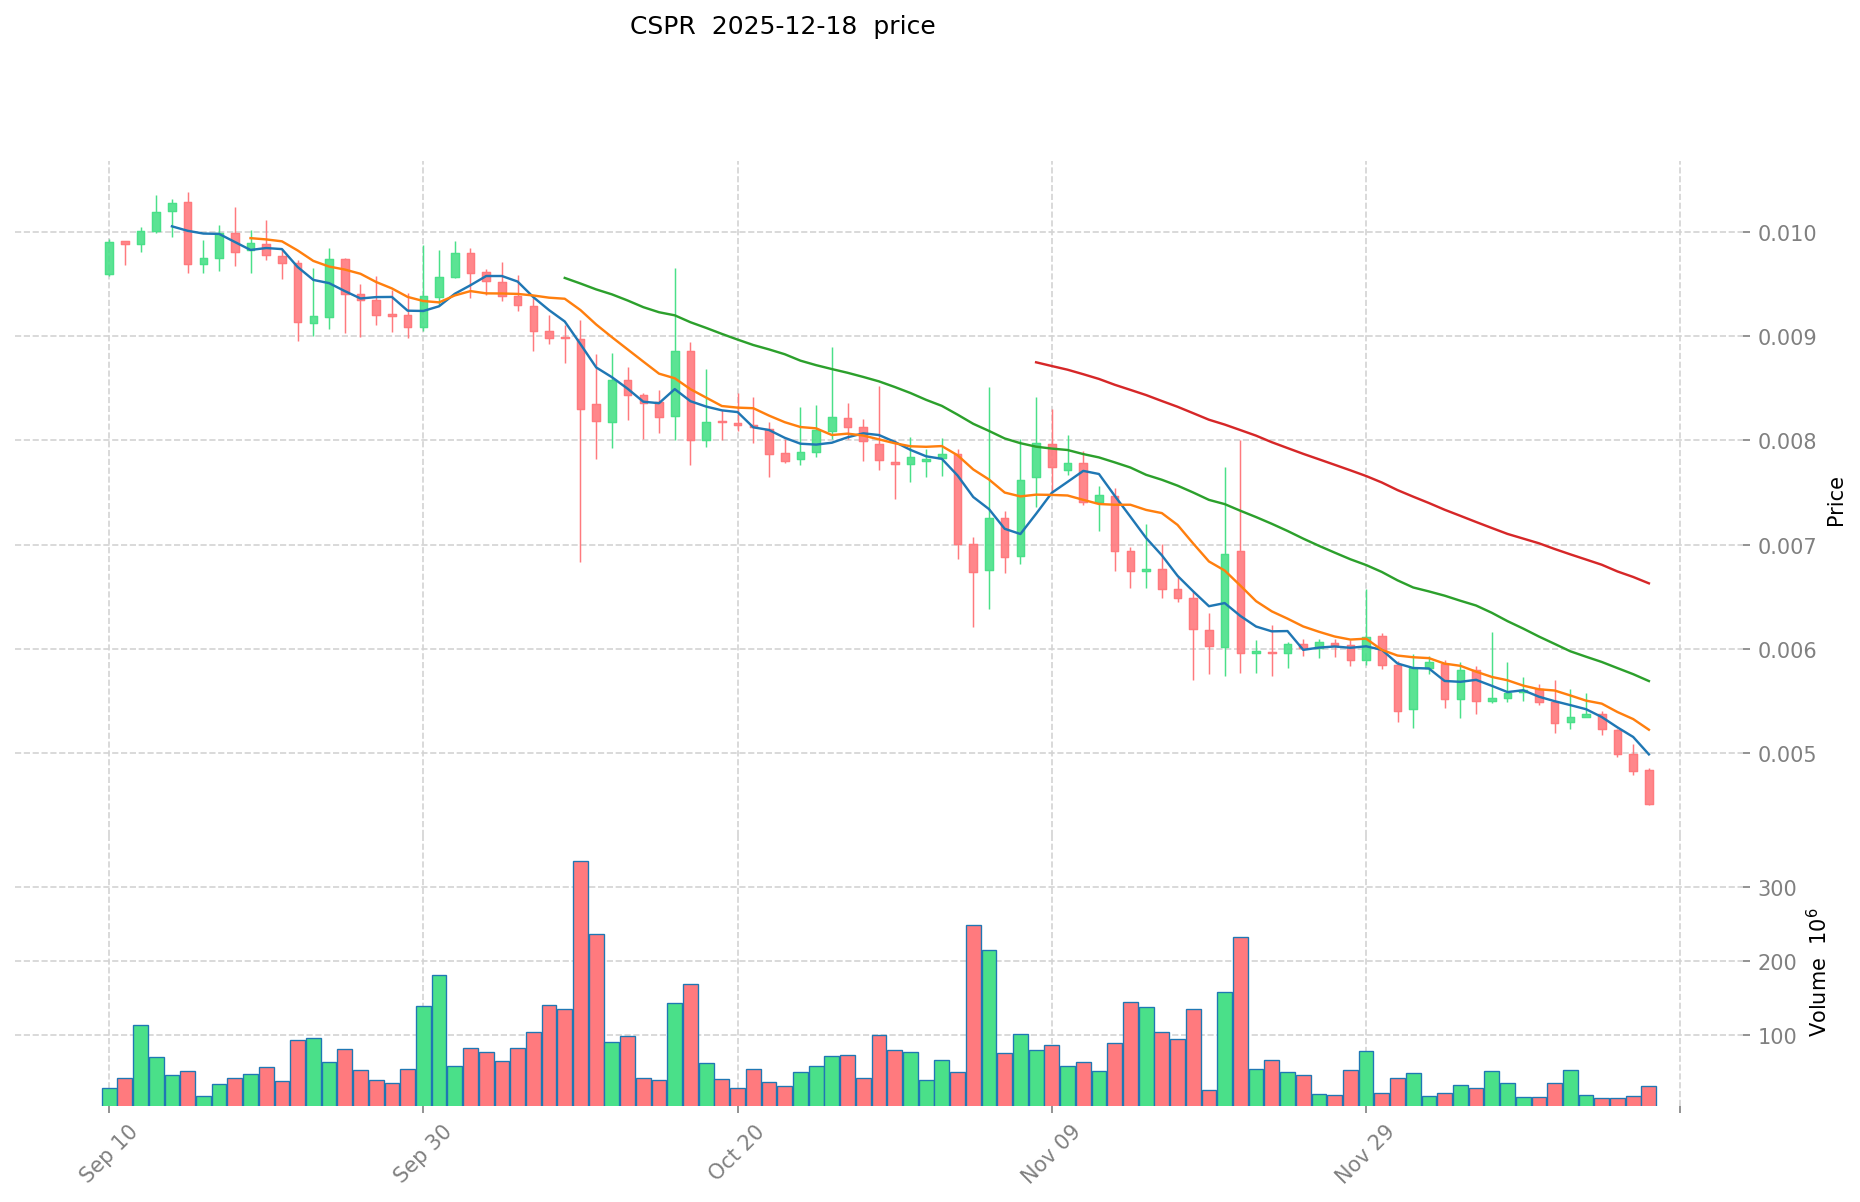
Casper (CSPR):
- All-time high: $1.36 USD (May 12, 2021)
- All-time low: $0.0045 USD (December 18, 2025)
- Launch price: $0.0094 USD (March 2021)
- Current price: $0.004518 USD
- 1-year performance: -75.06%
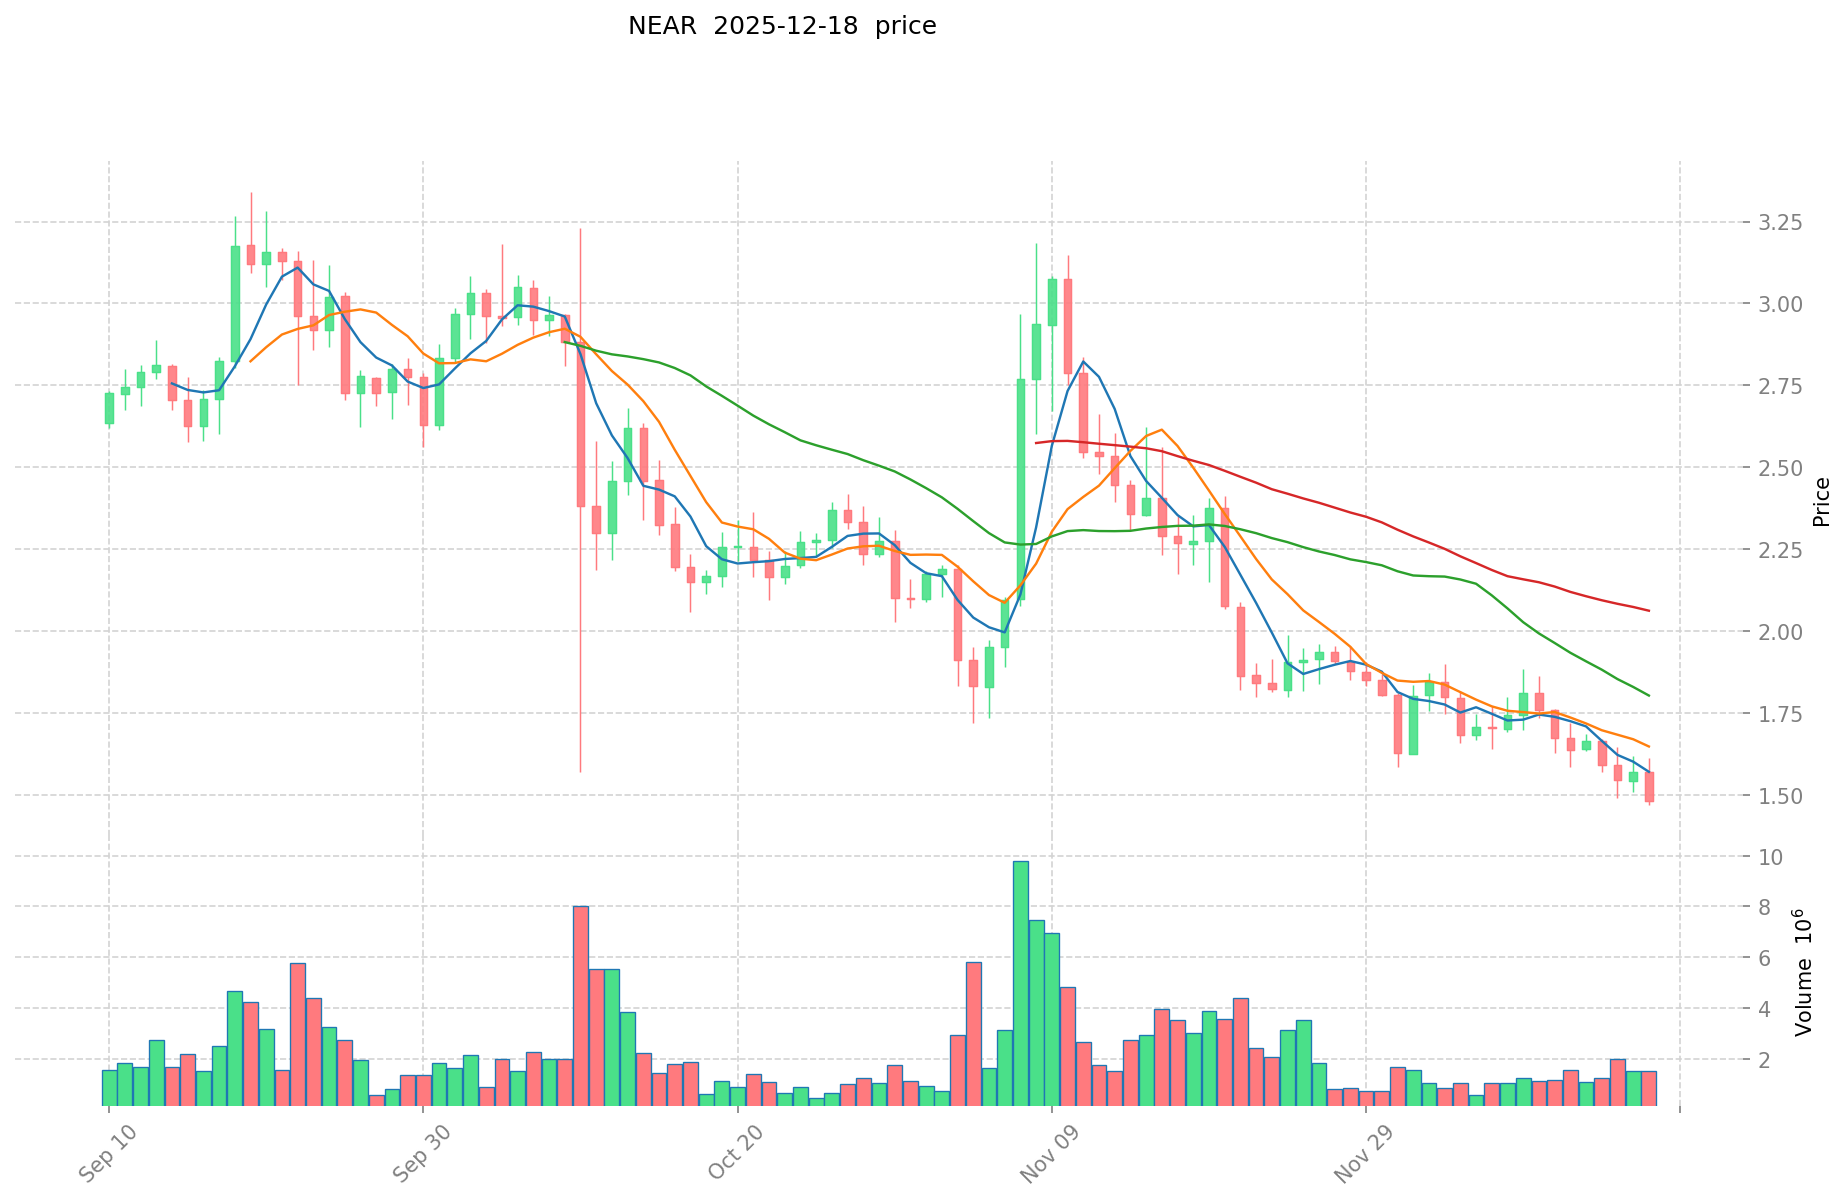
NEAR Protocol (NEAR):
- All-time high: $20.44 USD (January 17, 2022)
- All-time low: $0.5268 USD (November 5, 2020)
- Launch price: $0.0375 USD (October 2020)
- Current price: $1.483 USD
- 1-year performance: -76.78%
Comparative Analysis
Both Layer-1 blockchain projects have experienced significant price depreciation over the past year, with NEAR declining slightly more than CSPR on a percentage basis. However, NEAR maintains substantially higher absolute price levels and market capitalization. CSPR has reached its all-time low as of the current date (December 18, 2025), while NEAR remains well above its historical minimum despite recent weakness.
Current Market Status (December 18, 2025)
CSPR Metrics:
- Current price: $0.004518 USD
- 24-hour change: -5.77%
- 24-hour trading volume: $144,847.92
- Market capitalization: $64,005,005.56 USD
- Circulating supply: 13,683,280,344 CSPR
- Market rank: #443
NEAR Protocol Metrics:
- Current price: $1.483 USD
- 24-hour change: -5.36%
- 24-hour trading volume: $2,322,790.36
- Market capitalization: $1,902,336,218.03 USD
- Circulating supply: 1,282,762,119 NEAR
- Market rank: #49
Market Sentiment:
- Fear & Greed Index: 17 (Extreme Fear)
Current market pricing available at:
II. Technical Architecture and Protocol Features
Casper Network Technical Specifications
Casper operates as a Proof-of-Stake Layer-1 blockchain designed for on-chain tokenization of real-world assets. Key technical features include:
Consensus Mechanism:
- Zug Consensus: A deterministic protocol providing instant finality, critical for financial transactions and regulated asset workflows
Multi-Virtual Machine Support:
- Native support for multiple virtual machines operating in parallel
- Applications with different technical requirements can run natively on the same chain without requiring rollups or Layer-2 solutions
Developer Environment:
- Support for Rust, WebAssembly (WASM), and mainstream languages (JavaScript, Python, Go)
- Protocol-level access control
- Upgradable smart contracts
- Infrastructure designed for tokenized asset management
NEAR Protocol Technical Specifications
NEAR Protocol operates as a highly scalable Layer-1 blockchain utilizing sharding technology for performance optimization. Core features include:
Scalability Approach:
- State sharding technology enabling linear scalability with network node count
- Design target: 100,000 transactions per second based on 1 million mobile nodes
Developer Tools:
- Comprehensive SDK support
- Mobile-first architecture enabling DApp execution on mobile devices
- Focus on user-friendly development environment
Token Utility:
- Payment mechanism for validator fees
- Network security provision through validator node operations
- Access to network computation and storage resources
III. Market Performance Metrics Comparison
| Metric | CSPR | NEAR |
|---|---|---|
| Market Capitalization | $64.0M | $1,902.3M |
| Market Rank | #443 | #49 |
| Circulating Supply Ratio | 96.59% | 128.28% |
| 24h Volume (USD) | $144,847.92 | $2,322,790.36 |
| 1-hour change | +0.31% | -0.41% |
| 7-day change | -18.97% | -13.83% |
| 30-day change | -29.86% | -34.99% |
| Exchange Listings | 13 | 55 |
| Holder Count | 344,862 | 43,961 |
IV. Market Position and Ecosystem Maturity
CSPR Position:
- Significantly smaller market capitalization reflecting limited adoption
- Lower liquidity relative to NEAR, with fewer exchange listings
- Higher holder count suggesting broader retail participation
- Recent price discovery at all-time low levels
NEAR Position:
- Established position in Layer-1 ecosystem rankings
- Substantially larger trading liquidity and exchange availability
- More concentrated holder base
- Remains in consolidation phase despite recent weakness
V. Current Market Context
Both protocols are experiencing synchronized market weakness consistent with broader cryptocurrency market conditions. The Fear & Greed Index reading of 17 (Extreme Fear) indicates prevailing market pessimism affecting risk asset valuations across the sector. NEAR's higher absolute price level and superior market liquidity provide it with relatively better trading conditions compared to CSPR's limited on-chain volume and exchange availability.
Investment Value Analysis: CSPR vs NEAR
I. Executive Summary
This report analyzes the core investment value factors for Casper (CSPR) and NEAR Protocol based on available reference materials. The analysis focuses on network fundamentals, technical capabilities, and market dynamics while maintaining analytical rigor without speculative inference.
II. Core Factors Impacting CSPR vs NEAR Investment Value
Network Activity & Adoption Metrics
CSPR - Casper Network:
- Active address growth on mainnet represents a primary valuation indicator
- Staking participation rates and validator node distribution health are critical health metrics
- Enterprise-level application adoption scale directly influences network utility
- NFT functionality currently deployed for on-chain patent storage, demonstrating real-world use cases
NEAR Protocol:
- Market share metrics and technology innovation serve as key evaluation factors
- Network adoption and enterprise application deployment impact intrinsic value
Core observation: Both projects' investment value fundamentally depends on network activity levels, enterprise application adoption scale, and market supply-demand dynamics.
Technical Architecture & Capabilities
CSPR - Advanced Features:
- Advanced NFT functionality with active deployment for intellectual property storage on-chain
- Upgradeable smart contracts enabling protocol evolution without hard forks
- Architecture based on Vitalik's Ethereum CBDC proposal framework
NEAR Protocol:
- Market share positioning and technical innovation capability serve as evaluation cornerstones
Market Performance Dynamics
Price Volatility Factors:
- CSPR price fluctuations are driven by market supply-demand relationships, industry-wide trends, and Casper network's autonomous development progress
- Market sentiment phases attract investor attention during industry hotspots, producing significant price movements
- Exchange listings (such as Binance) expand liquidity and market accessibility
Key Assessment Dimensions
Future Development Priorities for CSPR:
- Mainnet active address number growth trajectory
- Staking participation rate and validator node distribution health
- Enterprise-level application adoption realization scale
These fundamental factors serve as primary indicators for long-term value assessment.
Report Date: December 18, 2025
Methodology Note: This analysis is based exclusively on provided reference materials. Speculative projections or unsubstantiated inferences have been excluded per analytical standards.
III. 2025–2030 Price Forecast: CSPR vs NEAR
Short-term Forecast (2025)
- CSPR: Conservative $0.00243–$0.00451 | Optimistic $0.00451–$0.00654
- NEAR: Conservative $1.136–$1.475 | Optimistic $1.475–$1.711
Mid-term Forecast (2027–2028)
- CSPR may enter accumulation phase, with projected price range $0.00388–$0.00982
- NEAR may enter early appreciation phase, with projected price range $1.438–$2.033
- Key drivers: institutional capital inflows, ETF adoption, ecosystem development expansion
Long-term Forecast (2029–2030)
- CSPR: Base case $0.00621–$0.00900 | Bull case $0.01188–$0.01221
- NEAR: Base case $1.181–$1.969 | Bull case $2.244–$2.464
Disclaimer
The forecasts presented are based on historical data analysis and market modeling. Cryptocurrency markets are highly volatile and subject to regulatory, technological, and macroeconomic changes. These projections should not be considered as investment advice or guarantees of future performance. Past performance does not indicate future results. Investors should conduct independent research and consult financial advisors before making investment decisions.
CSPR:
| 年份 | 预测最高价 | 预测平均价格 | 预测最低价 | 涨跌幅 |
|---|---|---|---|---|
| 2025 | 0.00653805 | 0.004509 | 0.00243486 | 0 |
| 2026 | 0.0078434055 | 0.005523525 | 0.00325887975 | 22 |
| 2027 | 0.0098246939175 | 0.00668346525 | 0.003876409845 | 48 |
| 2028 | 0.009739813908825 | 0.00825407958375 | 0.006190559687812 | 83 |
| 2029 | 0.011875969705099 | 0.008996946746287 | 0.006207893254938 | 99 |
| 2030 | 0.012210656124061 | 0.010436458225693 | 0.00918408323861 | 131 |
NEAR:
| 年份 | 预测最高价 | 预测平均价格 | 预测最低价 | 涨跌幅 |
|---|---|---|---|---|
| 2025 | 1.711 | 1.475 | 1.13575 | 0 |
| 2026 | 1.9116 | 1.593 | 1.19475 | 7 |
| 2027 | 2.032668 | 1.7523 | 1.524501 | 18 |
| 2028 | 2.04388272 | 1.892484 | 1.43828784 | 27 |
| 2029 | 2.2437290304 | 1.96818336 | 1.180910016 | 32 |
| 2030 | 2.463968748384 | 2.1059561952 | 1.326752402976 | 41 |
Comparative Investment Analysis: CSPR vs NEAR Protocol
IV. Investment Strategy Comparison: CSPR vs NEAR
Long-term vs Short-term Investment Strategies
CSPR - Casper:
- Suited for investors focused on real-world asset tokenization potential and enterprise-level blockchain infrastructure development
- Long-term positioning targets investors with conviction in on-chain RWA (Real-World Assets) adoption and institutional enterprise workflows
- Short-term considerations reflect extreme market pessimism (Fear & Greed Index: 17), positioning current levels as potential accumulation points for longer-horizon participants
NEAR Protocol:
- Suited for investors seeking established Layer-1 infrastructure with proven developer ecosystem and mobile-first scalability focus
- Long-term positioning targets investors prioritizing ecosystem maturity, exchange liquidity, and proven transaction throughput capabilities
- Superior current market position and trading liquidity provide more accessible entry/exit mechanics for shorter-term tactical positioning
Risk Management and Asset Allocation
Conservative Investor Profile:
- CSPR: 10–15% allocation (speculative position in early-stage RWA infrastructure)
- NEAR: 20–25% allocation (established Layer-1 with superior liquidity and holder base diversity)
- Stablecoin allocation: 60–70% (reflecting prevailing extreme fear market sentiment)
Aggressive Investor Profile:
- CSPR: 25–35% allocation (potential value recovery from all-time low pricing; higher risk/reward profile)
- NEAR: 30–40% allocation (liquidity and ecosystem scale support larger position sizing)
- Diversified allocation: Remaining 25–45% across complementary Layer-1 and Layer-2 protocols
Hedging Instruments:
- Stablecoin reserves (USDC, USDT) for volatility management during extreme fear periods
- Dollar-cost averaging (DCA) strategy across 6–12 month horizons to reduce timing risk
- Cross-asset correlation analysis: Both tokens show synchronized weakness; diversification across different Layer-1 implementations (Ethereum, Solana, Avalanche) recommended
- Options strategies: NEAR's superior liquidity enables covered call strategies for income generation; NEAR trading volume supports put/call spread positioning
V. Potential Risk Comparison
Market Risk
CSPR - Casper:
- Extreme liquidity risk: 24-hour trading volume of only $144,847.92 creates significant slippage for institutional-scale positions
- All-time low pricing (December 18, 2025) reflects extended bear market conditions with uncertain price floor establishment
- Limited exchange listings (13 exchanges) restrict market accessibility and price discovery mechanisms
- Concentration risk: 344,862 holder count may mask significant whale positioning or distribution imbalances
NEAR Protocol:
- Market capitalization concentration: $1.9 billion places NEAR at #49 ranking, creating dependency on sustained institutional interest
- Relative weakness over past year (-76.78%) indicates sector-wide headwinds affecting Layer-1 competitiveness
- More concentrated holder base (43,961 addresses) compared to CSPR suggests potential for larger individual position movements
Technical Risk
CSPR - Casper:
- Mainnet maturity validation: Limited public data on active address growth trajectory and network health metrics required for infrastructure validation
- Virtual machine scalability: Multi-VM architecture requires sustained optimization to prevent performance degradation at scale
- Enterprise adoption execution risk: RWA tokenization requires regulatory clarity and institutional infrastructure integration not yet fully realized
NEAR Protocol:
- State sharding complexity: Advanced scalability mechanism introduces technical risk requiring sustained network maintenance and validator coordination
- Mobile node requirements: Target architecture (1 million mobile nodes) requires ecosystem infrastructure development at scale not yet fully demonstrated
- Validator distribution: Network security depends on maintaining sufficient geographic and institutional diversity among validator operators
Regulatory Risk
Jurisdiction-Specific Considerations:
- Both CSPR and NEAR face evolving cryptocurrency classification frameworks across major jurisdictions (US, EU, Singapore, Hong Kong)
- RWA tokenization (CSPR's core focus) faces emerging regulatory frameworks that may accelerate or impede adoption depending on regulatory jurisdiction guidance
- Staking rewards classification impacts tax treatment for validator participants and institutional investors across different regulatory regimes
- Layer-1 infrastructure protocols face potential regulatory classification changes affecting token utility characteristics and exchange listing availability
Global Regulatory Trends:
- MiCA (Markets in Crypto-Assets Regulation) in EU creates compliance requirements for both protocols' service providers
- Potential US regulatory clarity on blockchain infrastructure could beneficially impact Layer-1 token valuations or create compliance barriers depending on final regulatory framework design
VI. Conclusion: Which Is the Better Buy?
📌 Investment Value Summary:
CSPR - Casper Strengths:
- Positioning in emerging RWA (Real-World Assets) tokenization infrastructure segment with specialized technical capabilities (upgradeable smart contracts, multi-VM architecture)
- Extreme undervaluation metrics: All-time low pricing and depressed 24-hour volume may represent capitulation-level pricing for longer-term accumulators
- Enterprise-level focus differentiates from consumer-oriented Layer-1 projects
- Higher holder count (344,862) suggests broader retail participation potential
NEAR Protocol Strengths:
- Established Layer-1 market position (#49 ranking) with proven developer ecosystem and 55 exchange listings providing superior market accessibility
- State sharding technology demonstrates technical differentiation in scalability approach
- Substantially higher trading liquidity ($2.3M daily volume vs. $144K for CSPR) enables institutional positioning
- Mobile-first architecture targets emerging market adoption with differentiated use case focus
- 40.0% higher absolute token price provides better capital efficiency for institutional position sizing
✅ Investment Recommendations:
Retail/Emerging Investors:
- NEAR Protocol recommended for superior liquidity, exchange accessibility, and established market position reducing execution risk
- Conservative allocation strategy (20–25% NEAR, 10–15% CSPR, 60–70% stablecoins) appropriate given extreme fear market sentiment
- Educational focus on understanding each project's technical differentiation (RWA tokenization vs. sharding scalability) required before capital deployment
Experienced Investors:
- Tactical opportunities exist in both assets: CSPR at all-time lows may represent asymmetric risk/reward for experienced accumulators with 2-3 year time horizons
- NEAR's superior liquidity enables more sophisticated strategies (DCA accumulation, options positioning, yield farming opportunities across layer-1 ecosystem)
- Portfolio construction: 30–40% NEAR + 25–35% CSPR + 25–45% diversified Layer-1/Layer-2 allocation recommended for experienced participants
- Active monitoring of network metrics required: On-chain activity, staking participation rates, enterprise adoption announcements serve as leading indicators for valuation re-rating
Institutional Investors:
- NEAR Protocol prioritized for market accessibility, liquidity depth sufficient for meaningful position establishment, and established custody/infrastructure integration
- CSPR appropriate for specialized thematic allocations targeting RWA infrastructure infrastructure theme with patient 3-5 year capital horizons
- Detailed due diligence required: Network fundamentals analysis (active addresses, validator distribution, transaction throughput), enterprise partnership pipeline review, and regulatory monitoring across target deployment jurisdictions
- Engagement with project teams recommended for infrastructure validation, roadmap timing clarification, and enterprise adoption pipeline assessment
⚠️ Risk Disclaimer:
Cryptocurrency markets demonstrate extreme volatility with price movements subject to rapid reversal based on regulatory announcements, macroeconomic conditions, and competitive technology developments. The price forecasts presented (2025–2030 projections) are based on historical data modeling and represent illustrative scenarios rather than guaranteed outcomes. Past cryptocurrency performance does not indicate future results.
This analysis does not constitute investment advice, financial recommendation, or endorsement of either protocol. Investors must conduct independent research, evaluate personal risk tolerance, and consult qualified financial advisors before capital deployment decisions. All cryptocurrency investments carry material risk of partial or total capital loss.
Report Generated: December 18, 2025 None
FAQ: CSPR vs NEAR Investment Comparison
I. Market Performance Questions
Q1: What are the current price levels and market positions for CSPR and NEAR as of December 18, 2025?
A: CSPR is trading at $0.004518 USD with a market capitalization of $64.0 million, ranking #443. NEAR is trading at $1.483 USD with a market capitalization of $1,902.3 million, ranking #49. Both assets have experienced significant year-over-year declines (CSPR: -75.06%, NEAR: -76.78%). CSPR has reached its all-time low on the current date, while NEAR remains well above its historical minimum despite recent weakness.
Q2: How do the historical price trajectories of CSPR and NEAR differ?
A: CSPR reached an all-time high of $1.36 USD in May 2021 after launching at $0.0094 USD in March 2021. NEAR reached an all-time high of $20.44 USD in January 2022, launching at $0.0375 USD in October 2020. NEAR maintains substantially higher absolute price levels and market capitalization, while CSPR currently trades near its all-time low, indicating extended bear market conditions and uncertain price floor establishment.
Q3: What liquidity differences exist between CSPR and NEAR tokens?
A: NEAR demonstrates significantly superior liquidity with 24-hour trading volume of $2,322,790.36 USD and 55 exchange listings. CSPR exhibits extreme liquidity constraints with only $144,847.92 USD in daily volume and 13 exchange listings. This substantial liquidity differential creates material slippage risks for institutional-scale CSPR positions and restricts market accessibility for NEAR participants seeking to exit positions.
II. Technical Architecture Questions
Q4: How do the consensus mechanisms and scalability approaches differ between CSPR and NEAR?
A: Casper utilizes Zug Consensus, a deterministic protocol providing instant finality, optimized for financial transactions and regulated asset workflows. Casper features multi-virtual machine support enabling parallel operation of applications with different technical requirements. NEAR employs state sharding technology for linear scalability, with design targets of 100,000 transactions per second based on 1 million mobile nodes. CSPR prioritizes enterprise infrastructure and real-world asset tokenization, while NEAR prioritizes scalability and mobile-first architecture.
Q5: What are the primary technical differentiators in developer tooling and smart contract capabilities?
A: Casper offers protocol-level access control, upgradeable smart contracts enabling evolution without hard forks, and support for Rust, WebAssembly (WASM), and mainstream languages (JavaScript, Python, Go). NEAR provides comprehensive SDK support, mobile-first architecture enabling decentralized application execution on mobile devices, and a developer environment prioritizing accessibility. Casper's upgradeable smart contracts represent a significant technical advantage for long-term protocol evolution in enterprise environments.
III. Investment Strategy Questions
Q6: Which token is more suitable for conservative investors given current market conditions?
A: NEAR Protocol is recommended for conservative investors due to superior market liquidity, 55 exchange listings providing accessibility, and established #49 market ranking. A conservative allocation strategy should include 20-25% NEAR, 10-15% CSPR, and 60-70% stablecoin reserves given the extreme fear market sentiment (Fear & Greed Index: 17). NEAR's higher absolute price level and greater institutional adoption reduce execution risk compared to CSPR's extreme liquidity constraints.
Q7: What investment opportunities exist for experienced investors seeking asymmetric risk-reward positioning?
A: CSPR presents a potential asymmetric opportunity for experienced accumulators given its all-time low pricing and depressed 24-hour volume, suitable for 2-3 year investment horizons targeting RWA infrastructure theme realization. NEAR offers superior liquidity enabling sophisticated strategies including dollar-cost averaging accumulation, options positioning (covered calls, put/call spreads), and yield farming opportunities. Experienced investors should construct diversified portfolios incorporating 30-40% NEAR, 25-35% CSPR, and 25-45% complementary Layer-1/Layer-2 allocations while monitoring network fundamentals as leading valuation indicators.
IV. Risk Assessment Questions
Q8: What are the primary risk factors differentiating CSPR and NEAR investment risks?
A: CSPR faces extreme liquidity risk ($144,847.92 daily volume), all-time low pricing with uncertain floor establishment, limited exchange accessibility (13 listings), and enterprise adoption execution risk requiring regulatory clarity for RWA tokenization. NEAR faces market capitalization concentration risk ($1.9 billion at #49 ranking), sector-wide headwinds affecting Layer-1 competitiveness, and more concentrated holder base (43,961 addresses) creating vulnerability to individual position movements. Both protocols face evolving regulatory frameworks affecting token classification and staking reward taxation across jurisdictions.
Report Date: December 18, 2025
Methodology Note: All responses derived exclusively from provided reference materials without speculative projections or unsubstantiated inferences.
Share
Content
Introduction: CSPR vs NEAR Investment Comparison
I. Historical Price Comparison and Current Market Status
II. Technical Architecture and Protocol Features
III. Market Performance Metrics Comparison
IV. Market Position and Ecosystem Maturity
V. Current Market Context
I. Executive Summary
II. Core Factors Impacting CSPR vs NEAR Investment Value
Short-term Forecast (2025)
Mid-term Forecast (2027–2028)
Long-term Forecast (2029–2030)
IV. Investment Strategy Comparison: CSPR vs NEAR
V. Potential Risk Comparison
VI. Conclusion: Which Is the Better Buy?
I. Market Performance Questions
II. Technical Architecture Questions
III. Investment Strategy Questions
IV. Risk Assessment Questions
How to Buy Cryptocurrency


Trending Cryptocurrencies


XZXX: A Comprehensive Guide to the BRC-20 Meme Token in 2025

Bitcoin Fear and Greed Index: Market Sentiment Analysis for 2025

Top Crypto ETFs to Watch in 2025: Navigating the Digital Asset Boom

5 ways to get Bitcoin for free in 2025: Newbie Guide
Bitcoin Market Cap in 2025: Analysis and Trends for Investors
2025 Bitcoin Price Prediction: Trump's Tariffs' Impact on BTC

Unveiling the Next Phase of Decentralized Finance Evolution

Top Emerging NFT Ventures in 2024

What is STRAX: A Comprehensive Guide to Understanding the Stratisphere's Native Token
What is FB: A Comprehensive Guide to Facebook and Its Impact on Social Media

What is ERG: A Comprehensive Guide to Exercise-Related Transient Abdominal Pain