2025 US Price Prediction: Expert Analysis of Market Trends and Economic Forecasts for the Coming Year

Introduction: Market Position and Investment Value of US
Talus Network (US) serves as an AI agent execution layer designed to enable verifiable on-chain workflows across consumer applications and developer tooling. The ecosystem comprises Nexus, a decentralized execution layer for AI agents; Talus Vision, a no-code builder allowing anyone to create and deploy agents; and Idol.fun, a consumer-facing AI entertainment platform generating real usage. As of December 2025, US maintains a market capitalization of approximately $25.34 million with a circulating supply of 2.1 billion tokens, currently trading at $0.01205. This innovative asset, recognized for its trustless verification and workflow automation infrastructure, is increasingly playing a pivotal role in driving mass adoption of AI agents through transparent, on-chain execution.
This article will comprehensively analyze US price trends through 2030, integrating historical patterns, market supply dynamics, ecosystem development, and macroeconomic factors to provide investors with professional price forecasts and actionable investment strategies.
Talus Network (US) Token Market Analysis Report
I. US Price History Review and Current Market Status
US Historical Price Evolution
Based on available data as of December 20, 2025:
- December 12, 2025: All-Time High (ATH) reached at $0.02709, marking the peak valuation since token launch
- December 15, 2025: All-Time Low (ATL) recorded at $0.01034, representing a significant correction from peak levels
- December 20, 2025: Current price at $0.01205, reflecting a 21.46% decline over the 30-day period and demonstrating continued price volatility in the recent market cycle
US Current Market Condition
As of December 20, 2025, the US token is trading at $0.01205 with a 24-hour trading volume of $740,368.14. The token has experienced moderate gains in the short term, with a 0.84% increase over the past hour and a 1.43% rise over the last 24 hours. However, the broader trend shows significant downward pressure, with a 32.92% decline over the 7-day period.
The token's market capitalization stands at $25,341,150, with a fully diluted valuation of $120,500,000. Currently ranked 771st by market cap, US has a circulating supply of 2,103,000,000 tokens out of a total and maximum supply of 10,000,000,000 tokens, representing a 21.03% circulation ratio. The token is currently listed on 19 exchanges and maintains an extremely limited holder base of just 7 addresses, indicating significant concentration risk.
Market sentiment remains in "Extreme Fear" territory with a VIX reading of 16, suggesting heightened market anxiety and risk aversion among investors. The token's market dominance remains minimal at 0.0037% of the total cryptocurrency market.
Click to view current US market price

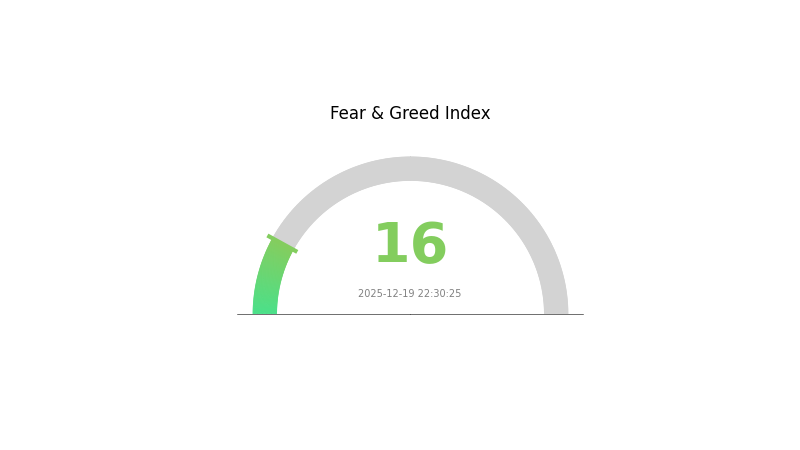
US Market Sentiment Indicator
2025-12-19 Fear and Greed Index: 16 (Extreme Fear)
Click to view the current Fear & Greed Index
The cryptocurrency market is experiencing extreme fear, with the Fear and Greed Index dropping to 16. This indicates significant market pessimism and heightened investor anxiety. During such periods, market volatility typically increases as participants rush to reduce risk exposure. This environment often presents contrarian opportunities for long-term investors, as assets may be oversold relative to their fundamental value. However, caution remains essential, as further downside pressure could materialize. Traders should implement strict risk management strategies and consider dollar-cost averaging to navigate through this turbulent phase.
US Holdings Distribution
The address holdings distribution chart illustrates the concentration of token ownership across the top addresses holding US tokens. This metric serves as a critical indicator of market decentralization, liquidity dynamics, and potential systemic risks associated with wealth concentration in the network.
The current distribution data reveals significant concentration risks within the US token ecosystem. The top four addresses collectively control 76.55% of total holdings, with the leading address (0xc063...055f2f) alone commanding 20.55% of the supply. This level of concentration is notably pronounced, as individual addresses exceeding the 20% threshold possess sufficient capital to exert substantial influence over market dynamics. The fifth-largest holder maintains 4.26% of holdings, while the remaining addresses account for only 19.19% of the total supply. Such asymmetric distribution patterns indicate that market movements are heavily dependent on the actions of a small number of large stakeholders, creating elevated vulnerability to potential coordinated selling pressure or strategic token movements.
This degree of concentration poses meaningful implications for market structure and price stability. The presence of four whale addresses controlling over three-quarters of the circulating supply suggests limited liquidity depth outside these major holders, which could amplify volatility during periods of significant on-chain activity or rebalancing events. Furthermore, the concentration pattern raises considerations regarding true decentralization metrics and the resilience of the network against potential market manipulation scenarios. Monitoring the movement patterns of these top addresses remains essential for assessing future market sentiment shifts and potential liquidity events that could impact broader market dynamics.
Click to view current US Holdings Distribution
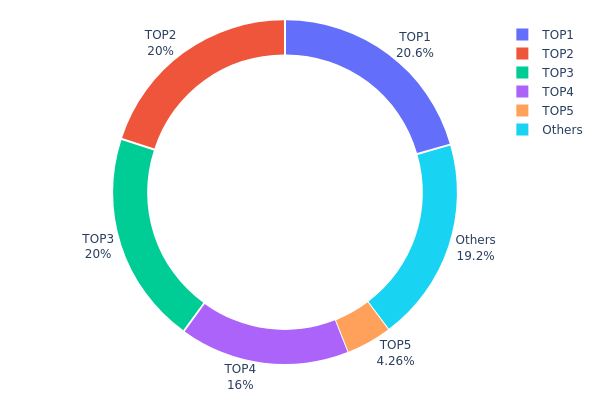
| Top | Address | Holding Qty | Holding (%) |
|---|---|---|---|
| 1 | 0xc063...055f2f | 2055284.00K | 20.55% |
| 2 | 0x4837...d8a033 | 2000000.00K | 20.00% |
| 3 | 0xa018...aafc50 | 2000000.00K | 20.00% |
| 4 | 0x5dbc...421bf6 | 1600000.00K | 16.00% |
| 5 | 0x185f...bf9e97 | 426143.68K | 4.26% |
| - | Others | 1918572.32K | 19.19% |
Core Factors Influencing US Dollar Future Price Movements
Macroeconomic Environment
Monetary Policy Impact
-
Federal Reserve Rate Decisions: The Federal Reserve's monetary policy trajectory represents a critical driver of USD movements. In 2025, the Fed implemented three rate cuts totaling 75 basis points. Market expectations for 2026 have shifted significantly, with consensus forecasts suggesting a "gradual rate-cutting" phase rather than aggressive easing. The timing and magnitude of future rate cuts will directly impact USD strength, as higher rates typically support currency appreciation.
-
Labor Market Conditions: U.S. unemployment has risen to 4.6% in November 2025, the highest level since October 2021, creating pressure for further monetary accommodation. This labor market weakness conflicts with persistent inflation concerns, creating policy uncertainty that pressures the dollar.
Inflation Dynamics
-
Tariff-Driven Inflation: Tariff policies implemented since spring 2025 have emerged as the primary inflation driver. According to Morgan Stanley estimates, the effective U.S. tariff rate has surged from 2-3% at year-start to approximately 16% currently. The Federal Reserve's research indicates tariffs have contributed approximately 0.3 percentage points to core goods inflation, with complete pass-through potentially reaching 0.7 percentage points. This inflation pressure constrains the Fed's ability to cut rates aggressively.
-
Core CPI Trends: U.S. core CPI rose to 2.6% year-over-year in November 2025, reflecting the ongoing transmission of tariff costs through the economy. Housing costs, which constitute roughly one-third of CPI, showed moderation with November year-over-year housing price increases of 3.0%, marking the smallest gain in over four years. However, service inflation remains elevated, supported by wage pressures.
-
Future Inflation Outlook: Tariff transmission effects are expected to persist throughout the first half of 2026, with inflation potentially peaking around mid-year before declining in the second half as tariff impacts diminish. This temporary nature of inflation pressure stems from its concentration in tariff-sensitive categories, with no systemic second-round wage-price spiral effects emerging.
Fiscal and Credit Considerations
-
Budget Deficit Pressures: The U.S. maintains a fiscal deficit of approximately 6.5% of GDP, requiring substantial Treasury issuance. This structural deficit, combined with record government debt levels, has prompted international rating agencies to downgrade U.S. government credit ratings. Government creditworthiness forms the foundation of sovereign currency value; its deterioration directly undermines USD stability and global investor confidence.
-
Debt Sustainability Concerns: Rising U.S. public debt raises questions about long-term currency credibility. The combination of fiscal imbalances and policy uncertainty has eroded global confidence in USD assets as a "safe haven," influencing currency valuation.
Policy and Institutional Dynamics
Federal Reserve Leadership Transition
-
Dovish Policy Expectations: Market participants anticipate potential leadership changes at the Federal Reserve in 2026. According to Polymarket prediction markets, nominee Bessent carries a 72% confirmation probability (up from 16% in early September), with dovish Federal Reserve Governor Waller at 12% probability. A dovish-oriented leadership could intensify monetary easing expectations, exerting downward pressure on the dollar.
-
Independence Concerns: Political pressures on Federal Reserve independence have emerged as a market concern. Such pressures could lead to more aggressive rate cuts than justified by fundamental economic conditions, further weakening the USD.
Tariff Policy Impact
- Large-Scale Tariff Implementation: The Trump administration's tariff escalation since spring 2025 has become the dominant policy factor affecting USD valuation. These tariffs create conflicting policy signals—while weaker USD could support manufacturing repatriation objectives, sustained dollar weakness undermines financial market confidence and global reserve currency status.
Global Sentiment and Capital Flows
International Reserve Currency Status Erosion
-
IMF Reserve Composition Shift: As of Q2 2025, the USD's share in global foreign exchange reserves declined to 56.32% from 57.79%, marking the 11th consecutive quarter below 60% and the lowest level in 30 years. This structural shift reflects growing portfolio diversification away from dollar assets.
-
Investor Confidence Deterioration: The April 2025 implementation of "equivalent tariffs" triggered significant Treasury selling, with U.S. government bond yields remaining above 4% throughout 2025 despite administration objectives to lower them. This price action signals investor loss of confidence in U.S. sovereign debt markets.
2026 Outlook
-
Continued Downward Pressure: Consensus forecasts from major investment banks compiled by Bloomberg suggest the USD could decline an additional 3% against major currencies (EUR, JPY, GBP) by end-2026. Deutsche Bank's analysis suggests the "long U.S. dollar bull market cycle of this century may be approaching its conclusion."
-
Stage-Based Dynamics: The dollar faces structural headwinds from economic policy contradictions, fiscal deterioration, and diminished reserve currency appeal. However, potential support could emerge if inflation resurges or economic data surprises to the upside, potentially prompting the Fed to slow rate-cut implementation.
Three, 2025-2030 Price Forecast
2025 Outlook
- Conservative Forecast: $0.00756 - $0.01356
- Base Case Forecast: $0.012
- Bullish Forecast: $0.01356 (requires sustained market stability and positive sentiment)
2026-2027 Mid-term Outlook
- Market Phase Expectation: Gradual recovery phase with incremental growth trajectory
- Price Range Forecast:
- 2026: $0.00818 - $0.01521
- 2027: $0.00952 - $0.02071
- Key Catalysts: Ecosystem development milestones, institutional adoption acceleration, and market sentiment normalization
2028-2030 Long-term Outlook
- Base Case Scenario: $0.01544 - $0.02551 (assumes steady adoption and moderate market cycles)
- Bullish Scenario: $0.02071 - $0.02849 (assumes accelerated network growth and positive regulatory developments)
- Transformational Scenario: $0.02849+ (extreme favorable conditions including mainstream institutional adoption and breakthrough utility expansion)
- December 20, 2030: Asset reaches $0.02849 (peak cycle valuation achieved)
Note: These price forecasts are derived from historical data patterns and market trend analysis. Actual prices may vary significantly based on macroeconomic conditions, regulatory changes, and technological developments. Investors should conduct thorough due diligence and consider using platforms like Gate.com for real-time market data before making investment decisions.
| 年份 | 预测最高价 | 预测平均价格 | 预测最低价 | 涨跌幅 |
|---|---|---|---|---|
| 2025 | 0.01356 | 0.012 | 0.00756 | 0 |
| 2026 | 0.01521 | 0.01278 | 0.00818 | 6 |
| 2027 | 0.02071 | 0.01399 | 0.00952 | 16 |
| 2028 | 0.02551 | 0.01735 | 0.01544 | 44 |
| 2029 | 0.02379 | 0.02143 | 0.0165 | 78 |
| 2030 | 0.02849 | 0.02261 | 0.01922 | 87 |
Talus Network (US) Professional Investment Strategy and Risk Management Report
IV. US Investment Methodology and Risk Management
US Investment Approaches
(1) Long-term Holding Strategy
- Suitable for: Investors who believe in AI agent infrastructure development and are willing to hold through market cycles
- Operational Recommendations:
- Accumulate during market downturns when the project demonstrates continued development progress
- Establish dollar-cost averaging (DCA) positions over extended periods to reduce average entry cost
- Secure storage of acquired tokens for extended holding periods
(2) Active Trading Strategy
- Technical Analysis Tools:
- Support and Resistance Levels: Monitor the recent trading range between $0.01156 (24h low) and $0.01242 (24h high) for entry and exit points
- Price Action Analysis: Track the 7-day decline of -32.92% and 24-hour recovery of +1.43% to identify reversal patterns
- Wave Trading Key Points:
- Pay attention to volume dynamics during price movements; current 24-hour volume of $740,368 provides baseline liquidity monitoring
- Establish stop-loss orders below recent support levels to manage downside risk during volatile periods
US Risk Management Framework
(1) Asset Allocation Principles
- Conservative Investors: 1-3% portfolio allocation
- Active Investors: 3-8% portfolio allocation
- Professional Investors: 5-15% portfolio allocation (with structured hedge strategies)
(2) Risk Hedging Solutions
- Position Sizing Strategy: Implement tiered position management where no single purchase exceeds predetermined portfolio percentage limits
- Stop-Loss Implementation: Set automatic stop-loss orders at 15-20% below entry points to limit potential losses
(3) Secure Storage Solutions
- Hot Wallet Option: Gate.com Web3 Wallet for frequent trading and active participation in ecosystem activities
- Cold Storage Approach: For long-term holdings, consider transferring tokens to secure self-custody solutions on the SUI blockchain
- Security Precautions: Maintain strong password protection, enable two-factor authentication, regularly verify contract addresses before transactions, and never share private keys or seed phrases with third parties
V. US Potential Risks and Challenges
US Market Risks
- Market Concentration Risk: With only 7 token holders currently identified, the token faces significant concentration risk that could lead to price volatility and liquidity constraints
- Liquidity Risk: 24-hour volume of $740,368 indicates relatively limited trading liquidity; large orders may experience significant slippage
- Valuation Volatility: The token has experienced a -32.92% decline over 7 days, indicating substantial price instability and potential for further corrections
US Regulatory Risks
- Jurisdictional Uncertainty: AI agent platforms may face evolving regulatory scrutiny from different jurisdictions regarding autonomous agent activities and liability frameworks
- Compliance Evolution: Changes in cryptocurrency regulations could impact token utility, staking mechanisms, and cross-border functionality
- Ecosystem Governance: Regulatory actions against AI applications or consumer platforms (such as Idol.fun) could indirectly affect token value and ecosystem adoption
US Technical Risks
- Smart Contract Vulnerability: As a SUI-based token powering complex AI agent workflows, potential bugs or exploits in contract code could impact token security
- Network Dependency: Reliance on SUI blockchain infrastructure means any network congestion or technical issues could impact US token transactions and ecosystem operations
- Scalability Challenges: As the Talus Network scales AI agent execution, technical limitations in throughput and latency could hinder user adoption and platform competitiveness
VI. Conclusions and Action Recommendations
US Investment Value Assessment
Talus Network presents an interesting proposition as an AI agent execution layer addressing the growing demand for verifiable on-chain AI workflows. However, investors should recognize that the project is in early stages with limited trading liquidity (740K daily volume), high token concentration (7 holders), and recent significant price volatility (-32.92% in 7 days). The fully diluted market cap of $120.5 million reflects speculative positioning in the emerging AI agent infrastructure sector. Long-term value depends on successful adoption of Nexus, Talus Vision, and Idol.fun platforms, combined with meaningful ecosystem growth.
US Investment Recommendations
✅ Beginners: Start with small pilot positions (1-3% of crypto allocation) through gate.com's trading platform, focusing on understanding the Talus ecosystem before increasing exposure
✅ Experienced Investors: Consider staged accumulation during volatility with technical analysis confirmation; implement strict position sizing and stop-loss discipline
✅ Institutional Investors: Evaluate the project's development roadmap, team credentials, and competitive positioning in AI agent infrastructure before committing capital; consider correlation with broader AI and blockchain sector trends
US Trading Participation Methods
- Spot Trading on Gate.com: Purchase US tokens directly on Gate.com's trading platform with various trading pairs and order types
- Staking and Ecosystem Participation: Once acquired, stake US tokens through the Talus Network ecosystem to earn rewards while supporting network operations
- Strategic Accumulation: Monitor ecosystem developments, platform adoption metrics, and technical milestones to inform timing of additional purchases
Cryptocurrency investing carries extreme risk and this report does not constitute investment advice. Investors must make decisions based on their individual risk tolerance and financial situation. It is strongly recommended to consult with professional financial advisors. Never invest more than you can afford to lose.
FAQ
How will the US market be in 2025?
The US market in 2025 is expected to see Big Tech and AI stocks outperform due to investor interest in undervalued sectors. High valuations may limit S&P 500 gains, while tariff de-escalation and government support could boost technology investments and market sentiment.
Is a 12% return realistic?
Yes, a 12% return is realistic. Many diversified investment vehicles historically achieve such returns. With consistent strategy and favorable market conditions, reaching this level is achievable for investors.
What if I invested $1000 in S&P 500 10 years ago?
If you invested $1,000 in the S&P 500 ten years ago, your investment would be worth approximately $3,676.90 today, representing a 267.69% gain.
Share
Content
Introduction: Market Position and Investment Value of US
I. US Price History Review and Current Market Status
Macroeconomic Environment
Policy and Institutional Dynamics
Global Sentiment and Capital Flows
Three, 2025-2030 Price Forecast
IV. US Investment Methodology and Risk Management
V. US Potential Risks and Challenges
VI. Conclusions and Action Recommendations
FAQ
How to Buy Cryptocurrency


Trending Cryptocurrencies


why is crypto crashing and will it recover ?

2025 SAHARA Price Prediction: Expert Analysis and Market Outlook for the Coming Year
2025 AITECH Price Prediction: Expert Analysis and Market Forecast for the Coming Year
2025 PAAL Price Prediction: Expert Analysis and Market Forecast for the Coming Year

Where to Find Alpha in the 2025 Crypto Spot Market

Sahara AI (SAHARA) Price Analysis: Recent Volatility Trends and Market Correlations

Is REI Network (REI) a good investment? Analyzing Market Potential, Risk Factors, and Future Prospects in 2024

Exploring Avalanche's EERC Token Protocol: A Comprehensive Overview

How DEX Screener Helps Discover Early Crypto Asset Opportunities

What Is Monero (XMR) Fundamentals: Whitepaper Logic, Use Cases, Technology Innovation, Roadmap Progress, and Team Background Explained

Step-by-Step Guide to Creating Your Own Digital Currency