2025 MDT Price Prediction: Expert Analysis and Market Outlook for Measurable Data Token in the Coming Year


Introduction: Market Position and Investment Value of MDT
MeasurableDataToken (MDT) is a decentralized big data value economic ecosystem based on blockchain technology that serves as a communication unit among users, data purchasers, and data suppliers. Since its inception in 2017, MDT has established itself as a bridge for quantifying data value and creating a more transparent data trading environment. As of 2025, MDT's market capitalization has reached approximately $13.54 million, with a circulating supply of around 606.32 million tokens, maintaining a price of approximately $0.013544. This asset, recognized for its innovative approach to data democratization, is increasingly playing a vital role in the decentralized data economy.
This article will provide a comprehensive analysis of MDT's price trends through 2030, integrating historical patterns, market supply and demand dynamics, ecosystem development, and macroeconomic factors to offer investors professional price forecasts and practical investment strategies for informed decision-making in the evolving digital assets landscape.
MeasurableDataToken (MDT) Market Analysis Report
I. MDT Price History Review and Current Market Status
MDT Historical Price Evolution
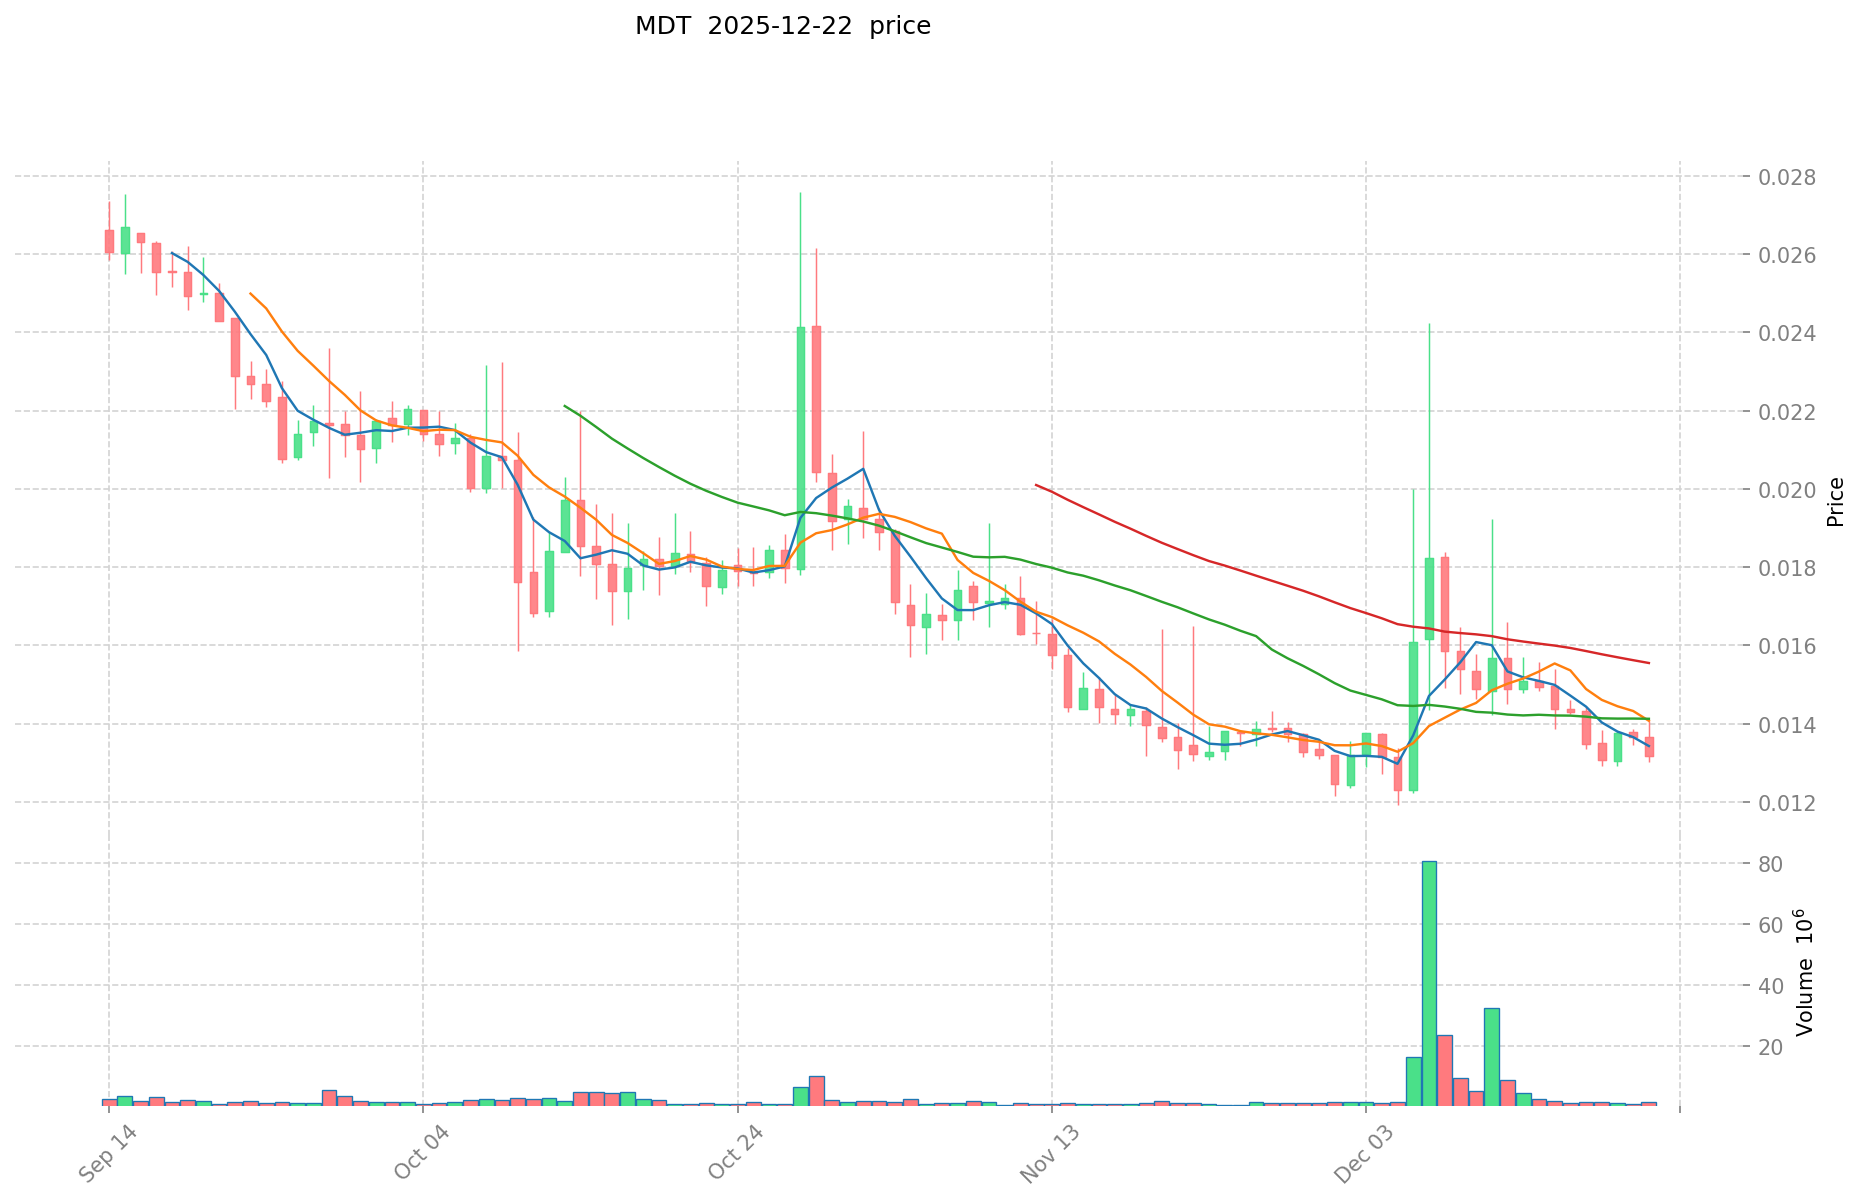
MDT was launched on January 2, 2018, with an initial price of $0.14. The token experienced significant price volatility throughout its lifecycle:
- 2021: MDT reached its all-time high (ATH) of $0.168053 on December 26, 2021, representing a peak of market enthusiasm during the bull cycle.
- 2018-2025: Following its peak in late 2021, MDT entered a prolonged correction phase. The token fell to its all-time low (ATL) of $0.00173261 on December 18, 2018, and has experienced a -75.99% decline over the past 12 months.
MDT Current Market Performance
As of December 22, 2025, MDT is trading at $0.013544, with a 24-hour trading volume of $16,743.88. The token has experienced the following recent price movements:
- 1-Hour Change: +0.15% ($0.000020 change)
- 24-Hour Change: -1.34% ($0.000184 change)
- 7-Day Change: -10.07% ($0.001517 change)
- 30-Day Change: +2.78% ($0.000366 change)
- 1-Year Change: -75.99% ($0.042866 change)
MDT's market capitalization stands at $8,211,994.51, with a fully diluted valuation of $13,544,000. The circulating supply is 606,319,736.12 MDT out of a total supply of 1,000,000,000 tokens, representing 60.63% circulation. The token maintains a market dominance of 0.00041% and is ranked 1,281 in terms of overall cryptocurrency market cap.
The current 24-hour price range is between $0.013016 (low) and $0.013803 (high). MDT is listed on 18 exchanges and has 30,316 token holders.
Visit Gate.com to check current MDT market price
MDT Market Sentiment Indicator
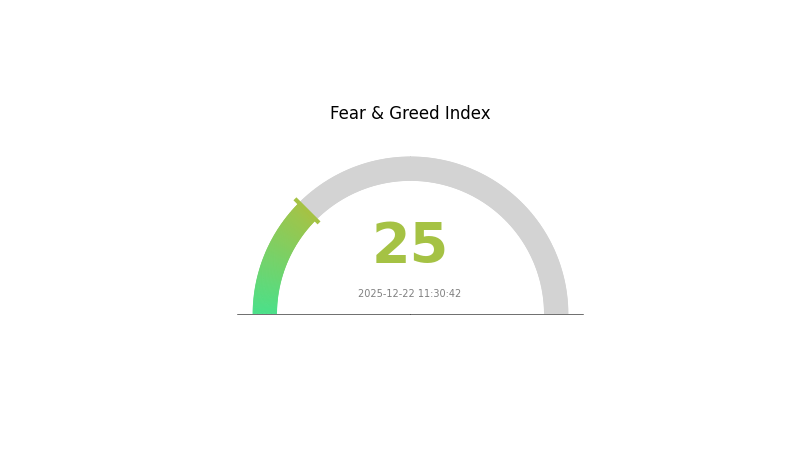
2025-12-22 Fear and Greed Index: 25 (Extreme Fear)
Click to view the current Fear & Greed Index
The cryptocurrency market is experiencing extreme fear, with the Fear and Greed Index hitting 25. This exceptionally low reading reflects significant market pessimism and heightened investor anxiety. During periods of extreme fear, markets often present contrarian opportunities for strategic investors, as assets become oversold. However, caution is warranted, as downward momentum may continue. Monitor key support levels and market developments closely. Consider dollar-cost averaging into positions rather than making lump-sum investments during such volatile conditions.
MDT Holdings Distribution
Address holdings distribution refers to the concentration of token ownership across different wallet addresses on the blockchain. This metric provides critical insights into the decentralization level of a cryptocurrency, the distribution of voting power among stakeholders, and the potential systemic risks associated with large holder concentration. By analyzing the top holders and their respective proportions, investors can assess market structure stability and evaluate the risk of price manipulation or sudden liquidity shifts.
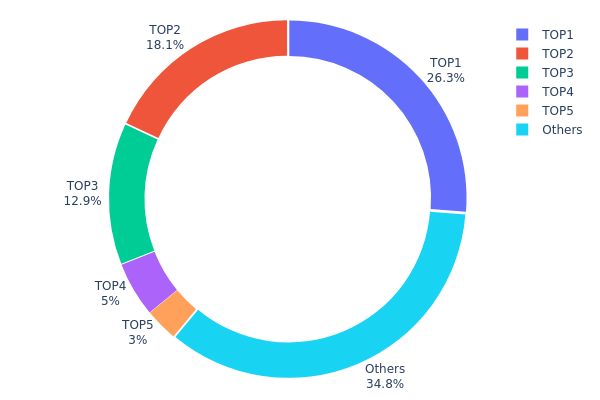
MDT exhibits a moderately concentrated holder structure, with the top five addresses controlling approximately 65.19% of total supply. The largest holder (0xf977...41acec) commands 26.25% of all MDT tokens, while the second-largest (0xa145...70c5b3) holds 18.09%, collectively representing 44.34% of circulating supply. This concentration level suggests potential vulnerability to coordinated actions by major stakeholders. However, the remaining 34.81% distributed among other addresses provides a degree of decentralization that mitigates extreme concentration risk. The distribution pattern indicates the presence of significant institutional or early investor holdings, which could influence market sentiment and price dynamics.
The current address distribution presents both structural characteristics and market considerations. While the top three addresses holding approximately 57.19% creates exposure to concentrated selling pressure or market manipulation risks, the substantial remaining ownership percentage prevents absolute centralization concerns. This structure is typical of projects with significant institutional backing or early venture funding, where large stakeholders typically retain considerable positions. The relative balance between top holders and the broader community suggests MDT maintains a reasonably distributed on-chain structure, though continued monitoring of major address movements remains essential for comprehensive market health assessment.
Click to view current MDT Holdings Distribution
| Top | Address | Holding Qty | Holding (%) |
|---|---|---|---|
| 1 | 0xf977...41acec | 262564.60K | 26.25% |
| 2 | 0xa145...70c5b3 | 181000.00K | 18.09% |
| 3 | 0x4f4d...8f0ca4 | 128597.48K | 12.85% |
| 4 | 0x5a52...70efcb | 50000.00K | 5.00% |
| 5 | 0x2eb0...45ae2a | 30000.00K | 3.00% |
| - | Others | 347837.92K | 34.81% |
II. Core Factors Affecting MDT's Future Price Movement
Market Sentiment and Derivatives Dynamics
-
Funding Rate Inversion: MDT's derivatives market funding rate has turned negative, indicating that short positions currently dominate the trading landscape. This occurs when market participants expect further price declines. Traders holding short positions are willing to pay fees to maintain their bearish positions, reflecting extreme market pessimism.
-
Price Performance Metrics: MDT has experienced significant downward pressure, with a 74.21% decline over the past year and a 2.8% drop in the last 24 hours. Price movements across different timeframes show: 1-hour (-0.55%), 7-day (-12.67%), and 30-day (-26.88%) declines.
-
Options Market Expansion: MDT's options market has reached a historic milestone with open interest totaling 500,000 contracts. This expansion reflects increased hedging and speculation demand, with diverse trading strategies including directional bets, volatility trading, and risk management approaches. The growth indicates market maturation and improved liquidity through tighter bid-ask spreads and enhanced price discovery efficiency.
Data Quality Metrics
-
Data Freshness (Time): According to MDT's team analysis, data freshness is a primary factor influencing data value and pricing. This core metric determines the utility and market demand for data within the Measurable Data Token ecosystem.
-
Data Specifications (Data Dimension): The dimensional quality and scope of data represent another fundamental driver of value in the platform's decentralized data economy.
Market Competition and Regulatory Environment
-
Policy Uncertainty Risk: MDT faces regulatory uncertainty risks, with policy changes potentially creating direct impacts on token price and market demand.
-
Intense Market Competition: The digital currency market operates in a highly competitive environment, particularly among mainstream cryptocurrencies, which pressures MDT's market positioning and adoption rates.
-
Market Sentiment Volatility: Market sentiment changes represent significant price drivers, influenced by social media activity and historical price trend analysis. Future price movements lack universal consensus, with projections varying significantly across analysts.
III. 2025-2030 MDT Price Forecast
2025 Outlook
- Conservative Forecast: $0.00881–$0.01356
- Base Case Forecast: $0.01356
- Optimistic Forecast: $0.01993 (requires sustained market recovery and increased adoption)
2026-2028 Medium-Term Outlook
- Market Phase Expectation: Gradual recovery phase with steady accumulation and institutional interest building
- Price Range Forecast:
- 2026: $0.01256–$0.02244
- 2027: $0.01313–$0.02332
- 2028: $0.01974–$0.02789
- Key Catalysts: Enhanced platform utility, ecosystem expansion, increased DeFi integration, and growing mainstream adoption of blockchain infrastructure
2029-2030 Long-Term Outlook
- Base Scenario: $0.02245–$0.03553 (assumes consistent network growth and moderate market sentiment improvement)
- Optimistic Scenario: $0.03553–$0.04214 (assumes accelerated enterprise adoption and breakthrough technological developments)
- Transformational Scenario: Above $0.04214 (extreme favorable conditions including regulatory clarity, mass institutional inflow, and paradigm shift in blockchain utility perception)
- 2025-12-22: MDT trading at average projected levels with consolidation patterns emerging (market stabilization phase)
| 年份 | 预测最高价 | 预测平均价格 | 预测最低价 | 涨跌幅 |
|---|---|---|---|---|
| 2025 | 0.01993 | 0.01356 | 0.00881 | 0 |
| 2026 | 0.02244 | 0.01675 | 0.01256 | 23 |
| 2027 | 0.02332 | 0.01959 | 0.01313 | 44 |
| 2028 | 0.02789 | 0.02145 | 0.01974 | 58 |
| 2029 | 0.03553 | 0.02467 | 0.02245 | 82 |
| 2030 | 0.04214 | 0.0301 | 0.01625 | 122 |
MDT Professional Investment Strategy and Risk Management Report
IV. MDT Professional Investment Strategy and Risk Management
MDT Investment Methodology
(1) Long-term Holding Strategy
- Suitable investors: Value-oriented investors who believe in blockchain-based data economy ecosystems and are willing to hold through market volatility cycles
- Operation suggestions:
- Establish a core position during market downturns when MDT trades significantly below historical highs, considering the token's 75.99% annual decline
- Implement dollar-cost averaging (DCA) over 6-12 months to reduce timing risk given current market conditions
- Set a predetermined exit strategy with profit targets at 50%, 100%, and 200% gains above entry price
(2) Active Trading Strategy
- Technical analysis tools:
- Support and Resistance Levels: Monitor key price points at historical highs ($0.168053), current trading price ($0.013544), and historical lows ($0.00173261) to identify breakout opportunities
- Volume Analysis: Track the 24-hour trading volume of $16,743.88 to identify strength of price movements and potential reversal signals
- Wave operation key points:
- Execute trades during periods of increased volatility when 24-hour changes exceed the current -1.34% threshold
- Utilize the 7-day decline of -10.07% as potential accumulation opportunities for swing traders
MDT Risk Management Framework
(1) Asset Allocation Principles
- Conservative investors: 0.5-1.5% of total portfolio allocation
- Active investors: 1.5-3% of total portfolio allocation
- Professional investors: 3-5% of total portfolio allocation (with hedging strategies)
(2) Risk Hedging Solutions
- Position sizing: Limit single trade exposure to no more than 2% of total capital given MDT's high volatility
- Diversification strategy: Balance MDT holdings with stable blockchain infrastructure projects to mitigate concentration risk
(3) Secure Storage Solutions
- Hot wallet option: Gate.com Web3 Wallet for frequent trading and easy access with standard security protocols
- Cold storage method: Transfer holdings to hardware wallets for long-term storage beyond 6 months to enhance security
- Security precautions: Enable two-factor authentication on all exchange accounts, regularly backup private keys in secure locations, never share seed phrases, and maintain separate wallets for trading and long-term storage
V. MDT Potential Risks and Challenges
MDT Market Risk
- Extreme price volatility: MDT has experienced a 75.99% decline over one year, with historical price swings from $0.00173261 to $0.168053, creating significant liquidation risk for leveraged positions
- Low trading liquidity: Current 24-hour volume of only $16,743.88 relative to market cap of $8.21 million indicates potential difficulty executing large orders without slippage
- Market cap concentration: With a relatively small market dominance of 0.0041%, MDT is susceptible to large investor exits and speculative trading patterns
MDT Regulatory Risk
- Cryptocurrency market regulations: Evolving global regulatory frameworks may impact data tokenization projects and token utility classification
- Data privacy compliance: As a data-focused ecosystem, MDT faces potential regulatory scrutiny regarding data protection standards and GDPR/CCPA compliance
- Token classification uncertainty: Regulatory bodies may reclassify MDT as a security or restricted instrument in certain jurisdictions, affecting trading accessibility
MDT Technology Risk
- Smart contract vulnerabilities: Any unaudited or newly discovered security flaws in the Ethereum-based token contract (0x814e0908b12A99FeCf5BC101bB5d0b8B5cDf7d26) could expose user funds
- Blockchain infrastructure dependency: Ethereum network congestion or failures directly impact MDT transaction processing and trading capability
- Ecosystem adoption: Limited evidence of mainstream adoption in the big data trading ecosystem may hinder long-term token utility and value sustainability
VI. Conclusion and Action Recommendations
MDT Investment Value Assessment
MDT operates within an innovative decentralized big data value ecosystem, addressing the gap between data providers and purchasers through blockchain-based token incentives. However, current market conditions present significant challenges: the 75.99% annual price decline, low trading volumes, and modest market capitalization suggest a project in consolidation phase. The token's utility depends heavily on ecosystem adoption rates and broader cryptocurrency regulatory developments. Investors should view MDT as a speculative, high-risk asset requiring careful position sizing and active risk management rather than a core portfolio holding.
MDT Investment Recommendations
✅ Beginners: Start with minimal position sizing (0.5-1% of crypto portfolio) through Gate.com's dollar-cost averaging approach; avoid leveraged trading until market conditions stabilize above key resistance levels
✅ Experienced investors: Utilize technical analysis on price levels relative to historical highs/lows; consider small accumulation positions during significant drawdowns; maintain strict stop-loss orders at 15-20% below entry price
✅ Institutional investors: Conduct thorough due diligence on project team and ecosystem partnerships; implement hedged positions combined with diversification; monitor regulatory developments affecting data tokenization projects
MDT Trading Participation Methods
- Gate.com spot trading: Purchase MDT tokens directly through the Gate.com platform's spot market, ideal for long-term holders seeking straightforward ownership
- Limit orders: Set predetermined buy orders at technical support levels to automate accumulation during price downturns
- Portfolio diversification: Combine MDT purchases with complementary blockchain infrastructure projects to reduce single-asset concentration risk
Cryptocurrency investment carries extremely high risk. This report does not constitute investment advice. Investors should make cautious decisions based on their risk tolerance and consult professional financial advisors. Never invest more than you can afford to lose.
FAQ
Does MDT crypto have a future?
Yes, MDT has promising potential. As a data tokenization platform, MDT addresses real-world data economy needs. Growing demand for decentralized data solutions and increasing institutional interest suggest strong long-term prospects for MDT's development and adoption.
What is the stock price forecast for MDT in 2025?
Based on current market analysis, MDT is projected to reach an average price range of $65-70 by end of 2025, driven by strong fundamentals and market demand in the healthcare sector.
Is MDT a good stock to buy?
MDT shows moderate growth potential with solid market performance. Strong fundamentals and consistent dividend payouts make it an attractive option for long-term investors seeking stable returns in the healthcare sector.
What is MDT's long-term outlook?
MDT's long-term outlook appears positive, with price projections reaching approximately $106 based on current market trends and technical analysis. Growing adoption and strong market fundamentals support continued upward momentum in the coming periods.
Share
Content
Introduction: Market Position and Investment Value of MDT
I. MDT Price History Review and Current Market Status
II. Core Factors Affecting MDT's Future Price Movement
III. 2025-2030 MDT Price Forecast
IV. MDT Professional Investment Strategy and Risk Management
V. MDT Potential Risks and Challenges
VI. Conclusion and Action Recommendations
FAQ
How to Buy Cryptocurrency


Trending Cryptocurrencies


How Has the Boost (BOOST) Price Surged 82.79% in the Past Week?

How Does the Crypto Market Overview Look in Late 2025?

2025 ARRR Price Prediction: Expert Analysis and Market Forecast for the Upcoming Year

NKN (NKN) price soaring: What is the driving force behind the 2025 craze?

Aergo Price Analysis: 112% Surge in 90 Days - What's Next for 2025?

Where to Find Alpha in the 2025 Crypto Spot Market

Unlocking the Future of Loyalty: Web3 Rewards and Programs

Unlocking Real Estate Investment: Lower Barriers Through Tokenization Platform Innovation

Is SUPERFORTUNE (GUA) a good investment?: A Comprehensive Analysis of Risk, Potential Returns, and Market Outlook

Is Chrema Coin (CRMC) a good investment?: A Comprehensive Analysis of Risk, Potential Returns, and Market Viability

Is Swell Network (SWELL) a good investment?: A Comprehensive Analysis of Tokenomics, Use Cases, and Market Potential