Купить криптовалюту
Оплатить в
USD
Купить и Продажа
Hot
Покупайте и продавайте криптовалюту через Apple Pay, карты, Google Pay, банковские переводы и т. д
P2P
0 Fees
Нулевые комиссии, более 400 способов оплаты и простая покупка и продажа криптовалюты
Gate Card
Криптовалютная платежная карта, обеспечивающая бесперебойные глобальные транзакции.
Торговля
Основа
Продвинутый
DEX
Ончейн торговля с Gate Wallet
Alpha
Points
Получите перспективные токены в упрощенной ончейн-торговле
Боты
Торговля в один клик с помощью автоматически запускаемых интеллектуальных стратегий
Копитрейдинг
Join for $500
Увеличивайте свое богатство, следуя примеру лучших трейдеров
Межбиржевая CrossEx торговля
Beta
Один баланс маржи, распределенный между платформами
Фьючерсы
Фьючерсы
Сотни контрактов, рассчитанных в USDT или BTC
TradFi
Золото
Торговля традиционными активами с помощью USDT в одном месте
Опционы
Hot
Торги опционами Vanilla в европейском стиле
Единый счет
Увеличьте эффективность вашего капитала
Демо-торговля
Начало фьючерсов
Подготовьтесь к торговле фьючерсами
Фьючерсные события
Участвуйте в мероприятиях и выигрывайте щедрые награды
Демо-торговля
Используйте виртуальные средства для торговли без риска
Earn
Запуск
CandyDrop
Собирайте конфеты, чтобы заработать аирдропы
Launchpool
Быстрый стейкинг, заработайте потенциальные новые токены
HODLer Airdrop
Удерживайте GT и получайте огромные аирдропы бесплатно
Launchpad
Будьте готовы к следующему крупному токен-проекту
Alpha Points
Торгуйте ончейн активами и получайте награды аирдропа!
Фьючерсные баллы
Зарабатывайте баллы и получайте награды аирдропа
Инвестиции
Simple Earn
Зарабатывайте проценты с помощью неиспользуемых токенов
Автоинвест.
Автоинвестиции на регулярной основе.
Бивалютные инвестиции
Покупайте дешево и продавайте дорого, чтобы получить прибыль от колебаний цен
Мягкий стейкинг
Получайте вознаграждения с помощью гибкого стейкинга
Криптозаймы
0 Fees
Заложите одну криптовалюту, чтобы занять другую
Центр кредитования
Единый центр кредитования
VIP-центр богатства
Настроенное вами управление капиталом способствует росту ваших активов
Управление частным капиталом
Индивидуальное управление активами для роста ваших цифровых активов
Количественный фонд
Лучшая команда по управлению активами поможет вам получить прибыль без лишних хлопот
Стейкинг
Делайте стейкинг криптовалюты, чтобы заработать на продуктах PoS
Умное плечо
New
Без принудительной ликвидации до погашения, беззаботный прирост с кредитным плечом
Минтинг GUSD
Используйте USDT/USDC чтобы минтить GUSD для доходности на уровне казначейских облигаций
Еще
MaxFINEancial
Пока нет содержимого
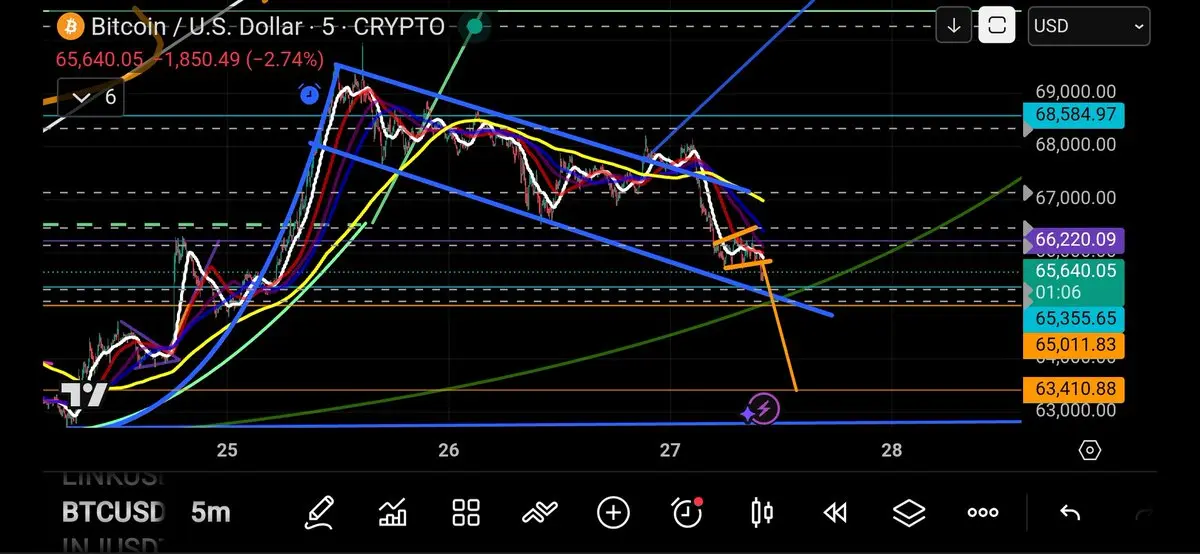
$BTC Действие цены только что пробило линию триггера 👀
Первое бычье повторное тестирование в процессе...
Видите этот быстрый прыжок вниз и немедленное разворот?
Это обычно хороший индикатор разворота с V-образным восстановлением...
Пора действовать!? 🤔
NFA, DYOR ⚠️
#Crypto #Торговля #BTC
Первое бычье повторное тестирование в процессе...
Видите этот быстрый прыжок вниз и немедленное разворот?
Это обычно хороший индикатор разворота с V-образным восстановлением...
Пора действовать!? 🤔
NFA, DYOR ⚠️
#Crypto #Торговля #BTC
BTC-5,49%
- Награда
- 1
- комментарий
- Репост
- Поделиться
- Награда
- 1
- комментарий
- Репост
- Поделиться
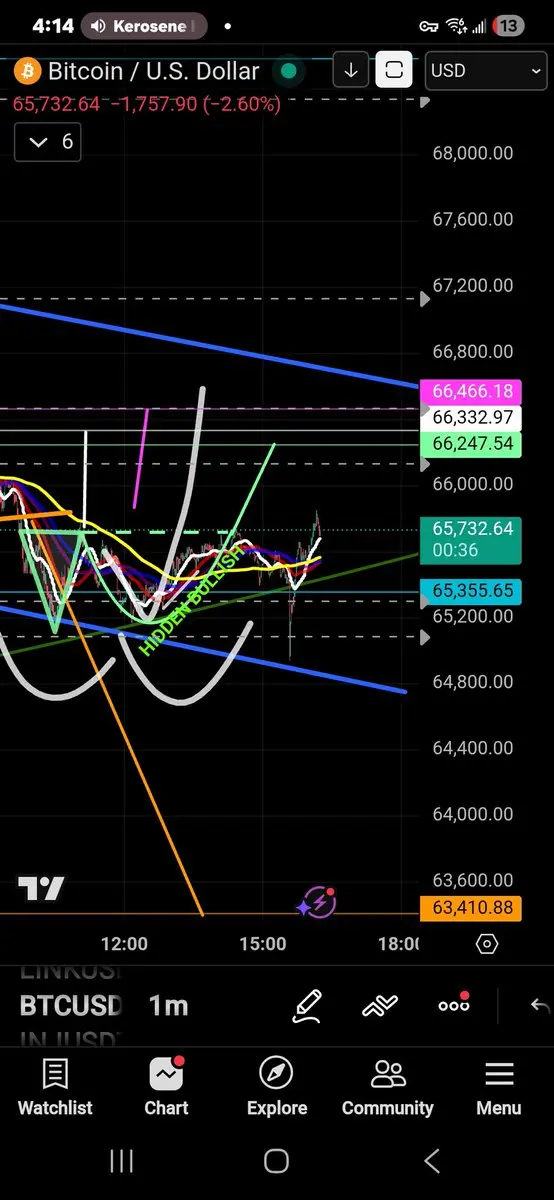
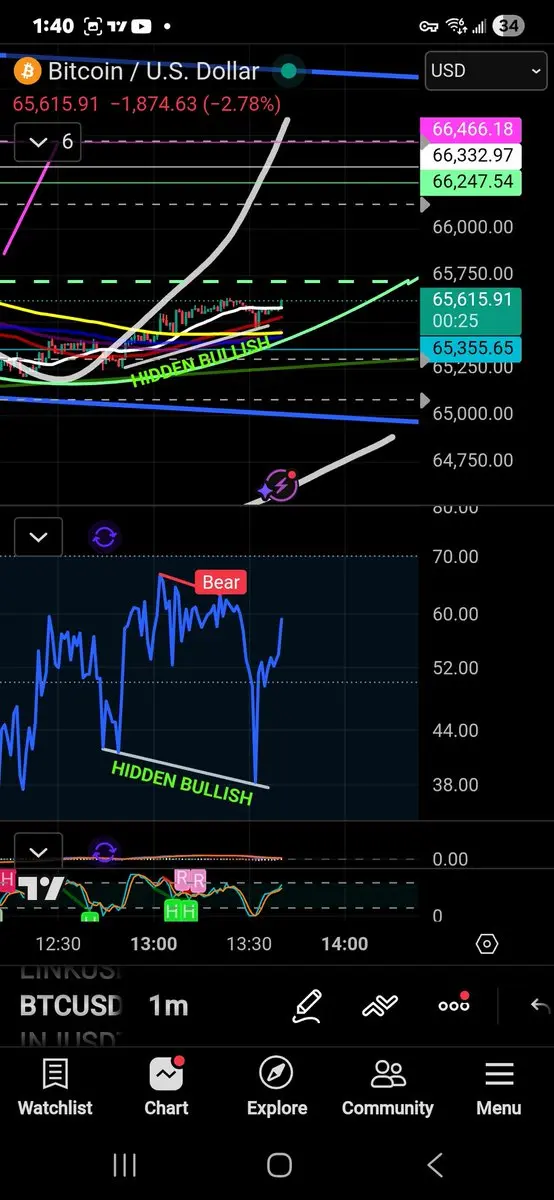
$BTC Скрытая бычья дивергенция
Скрытая бычья дивергенция между ценовым движением и RSI.
Это дает нам 90% вероятность достижения более высокого максимума, чем $65,629, перед пробоем ниже локального минимума в $65,244.
Более высокие максимумы и более высокие минимумы — так формируется восходящий тренд.
NFA, DYOR ⚠️
#Crypto #Торговля #BTC
BTC-5,49%
- Награда
- лайк
- комментарий
- Репост
- Поделиться
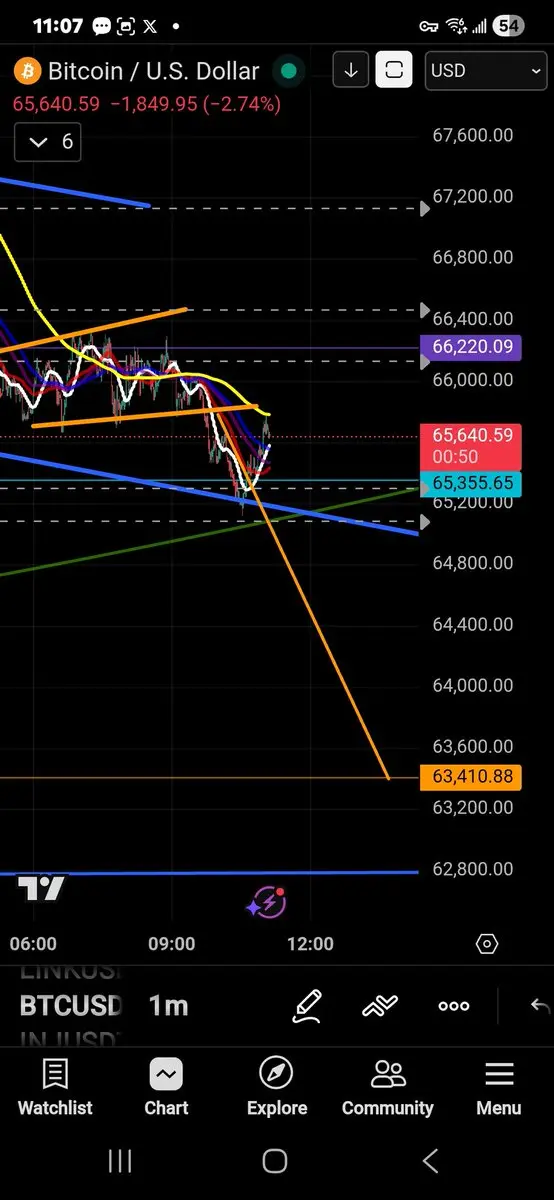
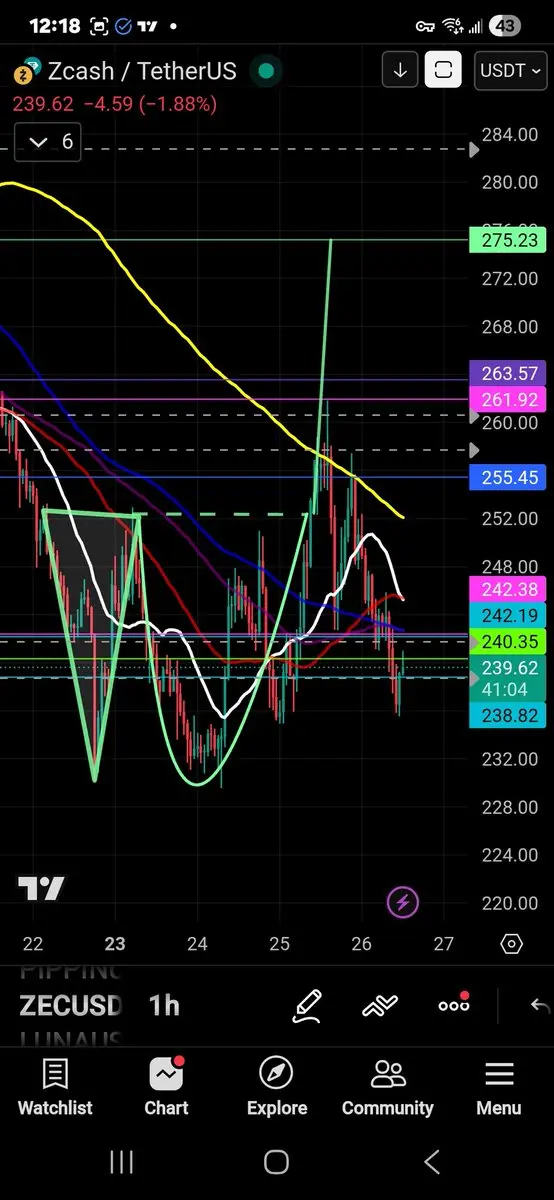
$BTC Адам Адам Ева Двойное дно!?
Теперь мы знаем игровое поле и с чем мы сталкиваемся.
Знание и видение всех возможностей важны.
Начинайте искать дивергенции и скрытые дивергенции на индикаторах.
Используйте меньшие таймфреймы, когда видите общую картину.
Нарисуйте игровое поле, позвольте ценовому движению показать, что происходит.
NFA,DYOR ⚠️
#Crypto #Торговля #BTC
BTC-5,49%
- Награда
- 1
- комментарий
- Репост
- Поделиться
- Награда
- лайк
- комментарий
- Репост
- Поделиться
- Награда
- 2
- комментарий
- Репост
- Поделиться
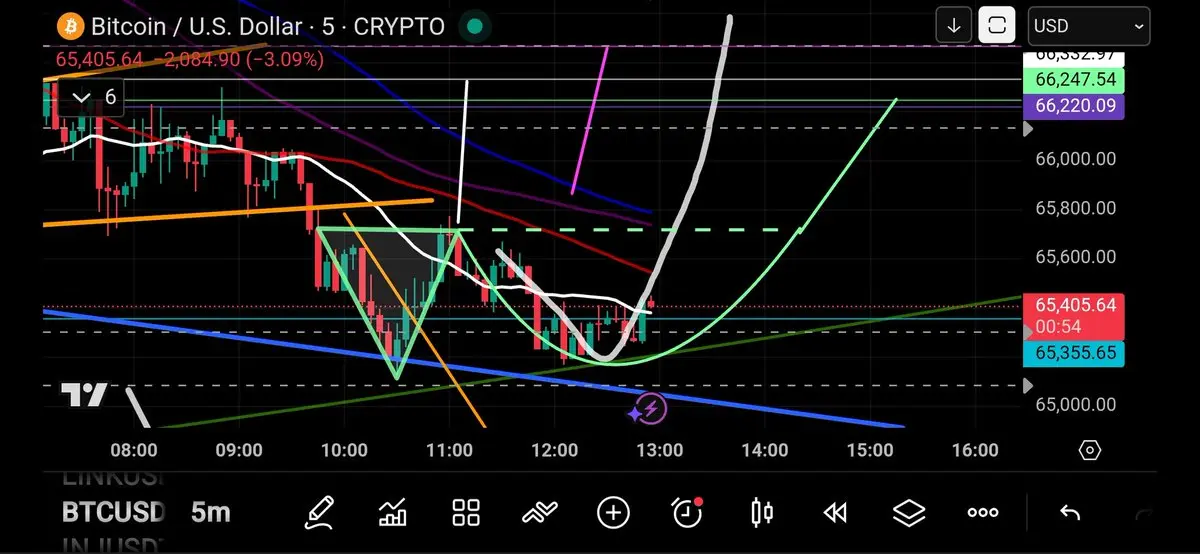
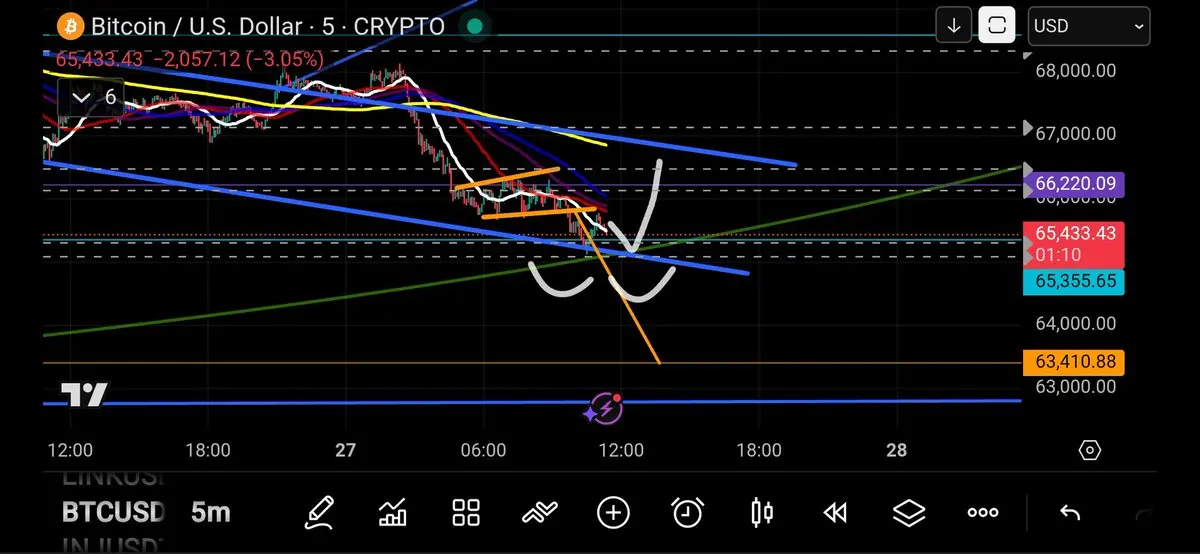
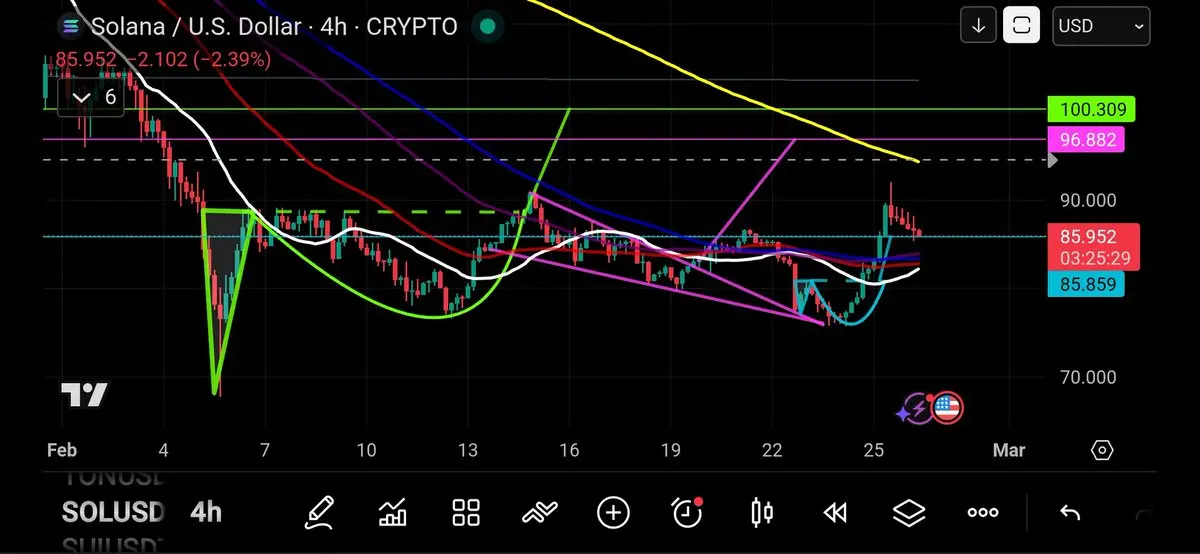
$BTC Показывает нам оба пути
Рискованное движение цены 🎲
Маленький оранжевый медвежий флаг на графике активирует новую цель снизу на уровне $63,410.
Итак, мы хотим, чтобы движение цены оставалось выше нижней синей линии тренда.
Эта цель актуальна и находится в зоне поддержки и сопротивления идеально.
О чем вам стоит знать... 👀
NFA, DYOR ⚠️
#Crypto #Торговля #BTC
BTC-5,49%
- Награда
- 1
- комментарий
- Репост
- Поделиться
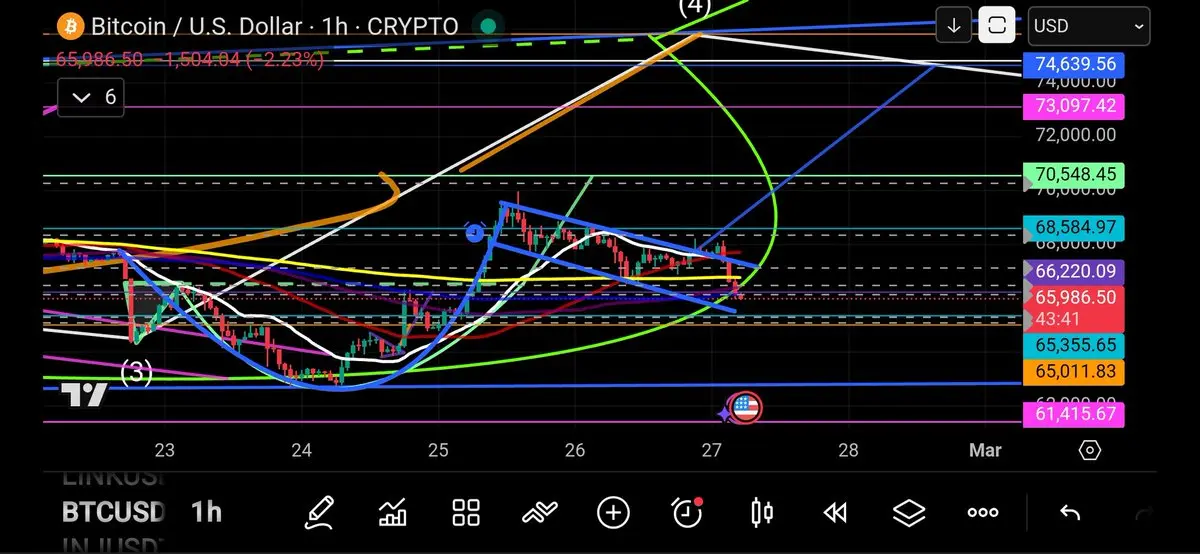
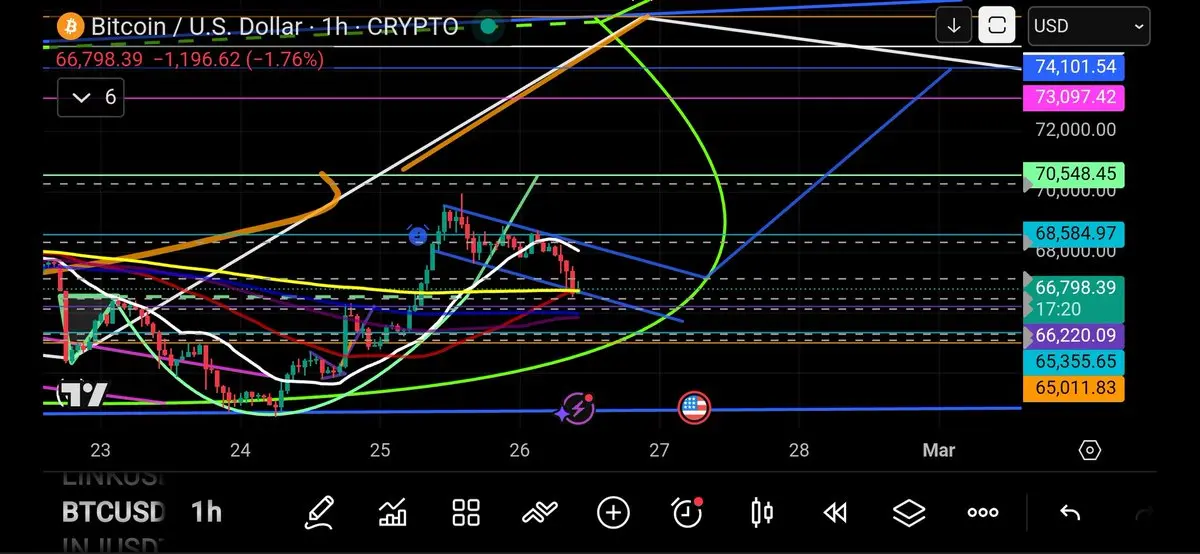
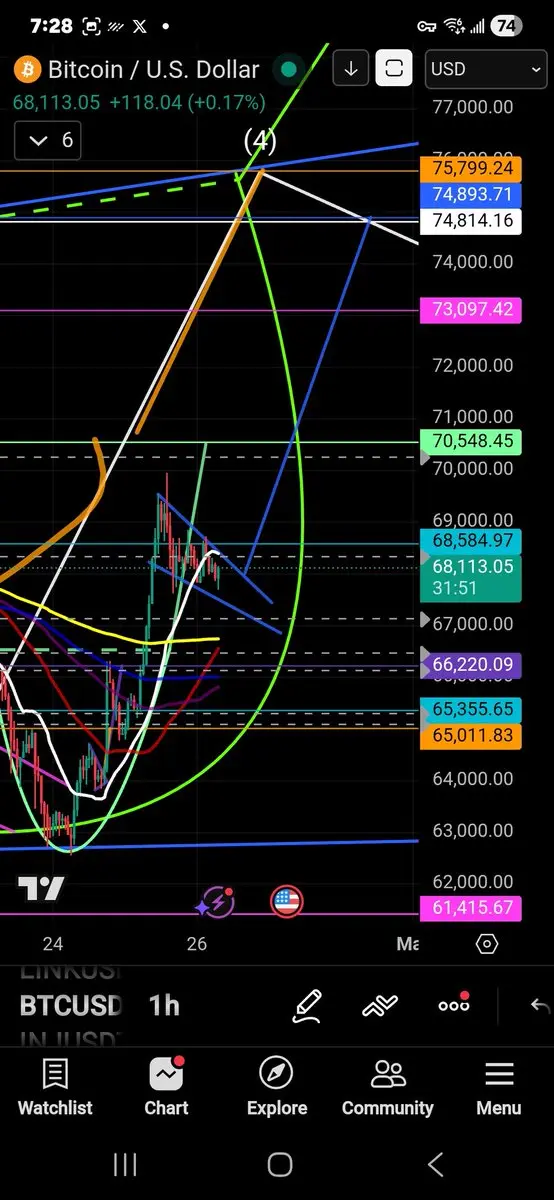
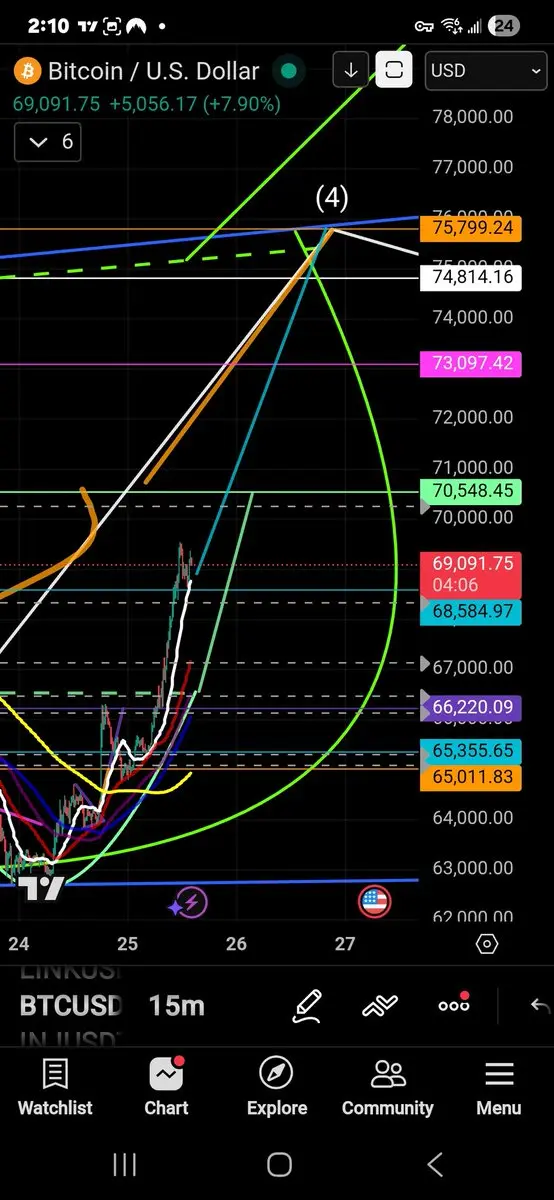
$BTC Фальшивый пробой и ложный выход из модели "Кубок и ручка" на снижение!?
Все еще в флаге...
Видите синюю модель "Кубок и ручка" с синей ручкой флага?
Предыдущая волна вверх кратковременно прорвала уровень вверх, но подтверждение бычьего ретеста не состоялось.
Цена вернулась в модель. Ниже желаемой 1-часовой 200MA для завершения пятой волны?
Быки захотят вернуть цену выше 1-часовой 200MA. Затем — верхняя синяя линия тренда на флаге "бычий флаг".
Ищите сигналы разворота обратно вверх в ближайшее время.
Здесь определенно есть шанс...
Прорыв вверх может нацелиться на $74,639.
NFA, DYOR ⚠️
#BTC
BTC-5,49%
- Награда
- лайк
- комментарий
- Репост
- Поделиться
Всё в порядке!
Запущено @TehLordKek — легендарным разработчиком $PEPE!
$FINE CA 🔥🐶🐸🔥
0x75c97384ca209f915381755c582ec0e2ce88c1ba
Запущено @TehLordKek — легендарным разработчиком $PEPE!
$FINE CA 🔥🐶🐸🔥
0x75c97384ca209f915381755c582ec0e2ce88c1ba
PEPE-9,52%

- Награда
- 2
- комментарий
- Репост
- Поделиться
- Награда
- лайк
- комментарий
- Репост
- Поделиться
- Награда
- 1
- комментарий
- Репост
- Поделиться
- Награда
- 1
- комментарий
- Репост
- Поделиться
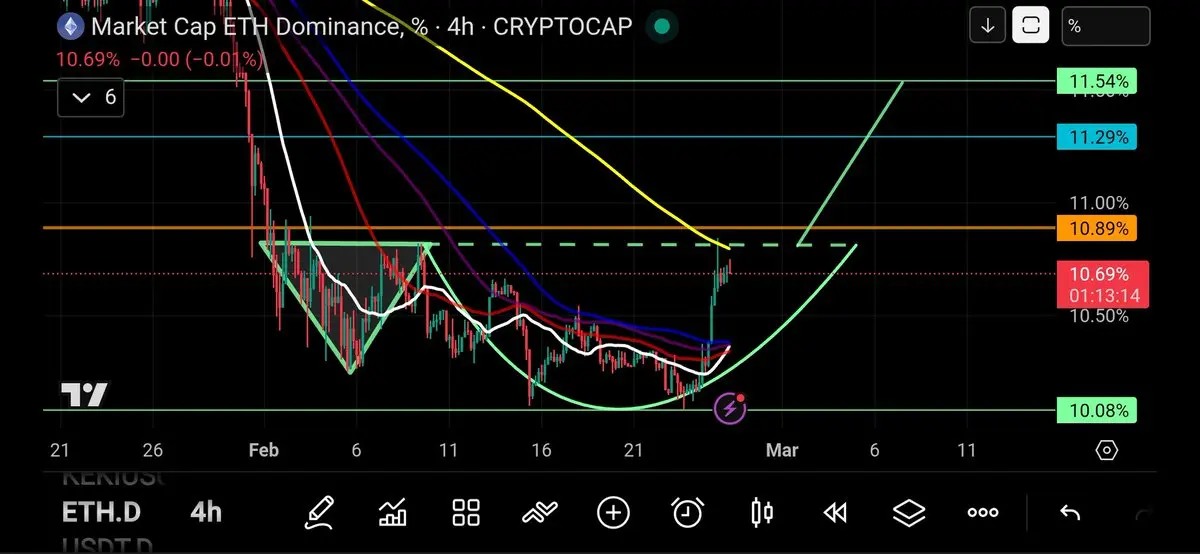
$ETH.D Доминирование Ethereum достигло линии триггера двойного дна "Адам и Ева"
Ценовое движение также заполнило здесь формирование 4-часового "денежного принтера".
Формирование "денежного принтера" происходит после отката вниз.
Обратите внимание, как почти все скользящие средние плотно собираются с ценой?
Жёлтая 200MA расположена с разрывом сверху?
Алгоритм обычно толкает цену вверх, чтобы заполнить разрыв между жёлтой 200MA.
Именно это и произошло здесь.
NFA, DYOR ⚠️
#Trading #ETH #Crypto
ETH-7,77%
- Награда
- лайк
- комментарий
- Репост
- Поделиться
- Награда
- 1
- комментарий
- Репост
- Поделиться
- Награда
- 2
- комментарий
- Репост
- Поделиться
- Награда
- 2
- комментарий
- Репост
- Поделиться
- Награда
- 1
- комментарий
- Репост
- Поделиться
- Награда
- 2
- комментарий
- Репост
- Поделиться