CHAITHU
加密货币内容创作者与直播主播,对区块链技术、市场趋势和去中心化充满热情。分享每日见解、教程和实时交易课程,旨在教育和赋能社区。
CHAITHU
🔹 反弹继续!美国股市再次创下新高,加密货币
1,006次观看
2026-05-06 09:41
- 赞赏
- 点赞
- 评论
- 转发
- 分享
咒术回战的讨论在Modulo第3卷额外内容的声称后爆炸,暗示乙骨憂太拥有最强版本的马霍加
报道的原因很简单,较长的战斗允许更大的适应性,让马霍加比由五条或宿儺看到的版本进一步进化
这一揭示在粉丝中引发了激烈的辩论,因为力量等级的讨论持续增长
事实:马霍加被认为是最危险的式神之一,因为它的适应能力让它能随着时间反制几乎任何攻击
来源:JJK Modulo第3卷额外内容和社区讨论报告
查看原文报道的原因很简单,较长的战斗允许更大的适应性,让马霍加比由五条或宿儺看到的版本进一步进化
这一揭示在粉丝中引发了激烈的辩论,因为力量等级的讨论持续增长
事实:马霍加被认为是最危险的式神之一,因为它的适应能力让它能随着时间反制几乎任何攻击
来源:JJK Modulo第3卷额外内容和社区讨论报告

- 赞赏
- 点赞
- 评论
- 转发
- 分享
🔹 美国公共债务超过GDP,影响比特币稀缺性理论
1,692次观看
2026-05-02 04:39
- 赞赏
- 点赞
- 评论
- 转发
- 分享
🔹 原油价格飙升 + 联邦储备内部分歧加剧!BTC
1,496次观看
2026-04-30 09:53
- 赞赏
- 点赞
- 2
- 转发
- 分享
ybaser:
2026 加油 👊查看更多
🔹 比特币反弹至76,000美元!加密货币总市值略有上升
957次观看
2026-04-29 08:42
- 赞赏
- 点赞
- 评论
- 转发
- 分享
最近的一项粉丝投票在《海贼王》社区引发了争论,近70%的投票者选择乌索普作为最具影响力的牺牲,以确立伊姆的真正威胁。这个结果让许多人感到惊讶,因为乌索普既是喜剧角色,也是船员的情感核心。
粉丝们仍然记得乌索普从一个胆小的骗子成长为勇敢的战士,使他可能的牺牲对草帽一伙来说非常具有情感意义。其他投票则分散在山治、甚平和弗兰奇之间,显示粉丝在如此重大的话题上意见分歧。
动画社区也在积极讨论其影响。观众们一直在争论这样的牺牲是否真的会提升剧情的紧张感,还是会越过故事的底线,突显粉丝们对系列未来的高度投入。
来源:Reddit投票讨论
#OnePiece #AnimeDebate
查看原文粉丝们仍然记得乌索普从一个胆小的骗子成长为勇敢的战士,使他可能的牺牲对草帽一伙来说非常具有情感意义。其他投票则分散在山治、甚平和弗兰奇之间,显示粉丝在如此重大的话题上意见分歧。
动画社区也在积极讨论其影响。观众们一直在争论这样的牺牲是否真的会提升剧情的紧张感,还是会越过故事的底线,突显粉丝们对系列未来的高度投入。
来源:Reddit投票讨论
#OnePiece #AnimeDebate

- 赞赏
- 3
- 5
- 转发
- 分享
NewName:
感谢您的信息!查看更多
🌐 世界最大的加密货币交易大战来了。
WCTC 第8季刚刚在 上启动,奖池绝对惊人:
💰 800万USDT等待争夺,涵盖三种史诗级格式:
🏆 队伍战 组建全球交易者团队,为180万USDT而战
⚔️ 王者PK 实时对决,只有最敏锐的交易者才能存活 160万USDT
📈 个人排名 展示你单打独斗的实力,瓜分200万USDT
无论你是经验丰富的专业人士,还是渴望挑战的雄心交易者,WCTC S8是传奇诞生的舞台。超过5500+支队伍已在激烈角逐,竞争激烈,赌注真实,时间紧迫。
这不仅仅是一场比赛。这是一场全球运动。
每一笔交易都至关重要。每一个仓位都意义非凡。每一秒都是登上排行榜、在加密历史上留下你的名字的机会。
🚀 不要在旁观者的角色中观看,让别人争夺奖励。
👉 现在就加入,名额有限:
🔗
#GateWCTCS8
查看原文WCTC 第8季刚刚在 上启动,奖池绝对惊人:
💰 800万USDT等待争夺,涵盖三种史诗级格式:
🏆 队伍战 组建全球交易者团队,为180万USDT而战
⚔️ 王者PK 实时对决,只有最敏锐的交易者才能存活 160万USDT
📈 个人排名 展示你单打独斗的实力,瓜分200万USDT
无论你是经验丰富的专业人士,还是渴望挑战的雄心交易者,WCTC S8是传奇诞生的舞台。超过5500+支队伍已在激烈角逐,竞争激烈,赌注真实,时间紧迫。
这不仅仅是一场比赛。这是一场全球运动。
每一笔交易都至关重要。每一个仓位都意义非凡。每一秒都是登上排行榜、在加密历史上留下你的名字的机会。
🚀 不要在旁观者的角色中观看,让别人争夺奖励。
👉 现在就加入,名额有限:
🔗
#GateWCTCS8

- 赞赏
- 3
- 4
- 转发
- 分享
NewName:
感谢您的信息!查看更多
- 赞赏
- 2
- 3
- 转发
- 分享
discovery:
LFG 🔥查看更多
🔹 比特币关键阻力位在80,000美元,触手可及!鲸鱼和ETF gia
1,112次观看
2026-04-24 06:32
- 赞赏
- 点赞
- 评论
- 转发
- 分享
🔹 比特币飙升至76,000美元!不要被这次上涨所迷惑——重大计划
1,292次观看
2026-04-22 09:34
- 赞赏
- 1
- 4
- 转发
- 分享
discovery:
LFG 🔥查看更多
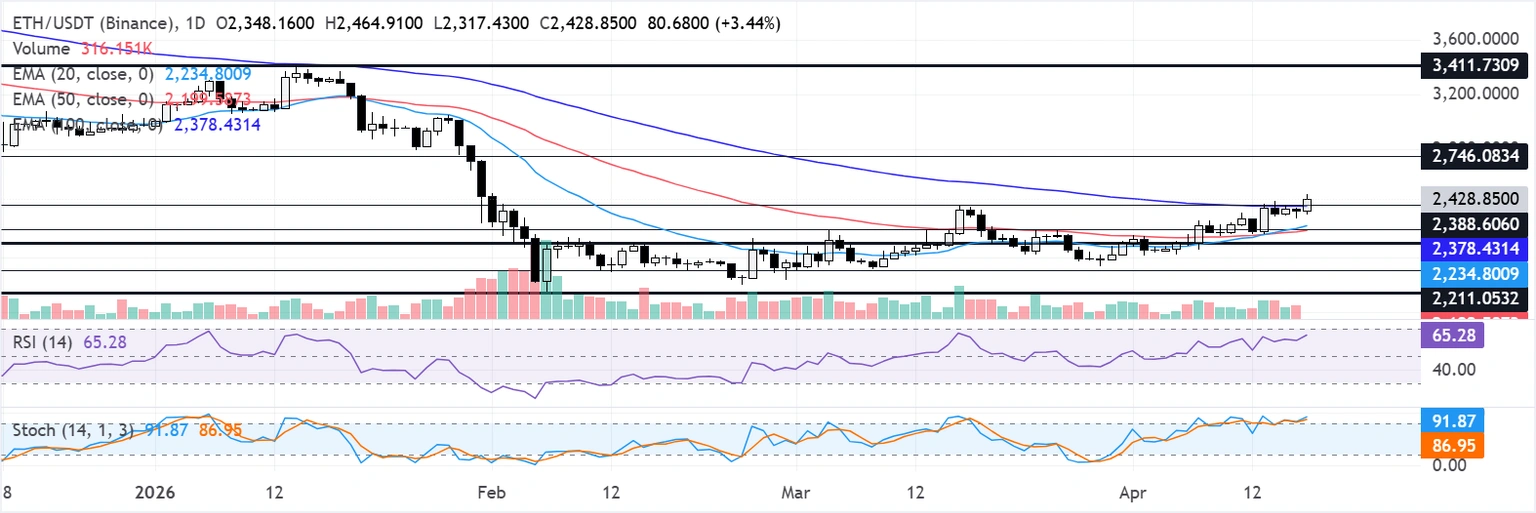
以太坊价格预测:ETH突破100日EMA和$2,388阻力位
根据Coinglass数据显示,过去24小时内以太坊大约清算了1.632亿美元,其中空头清算占1.409亿美元。
在日线图上,ETH已突破100日指数移动平均线(EMA),位于$2,378,以及$2,388的阻力位,此前连续五天多次测试这些水平。
该水平现作为即时支撑,而更深的回调可能会在20日EMA(EMA)的$2,234和由水平支撑及50日EMA定义的$2,211–$2,199区域吸引买盘。
在上方,初步阻力出现在接近$2,746的水平阻挡位,随后是更强的阻力位$3,411,突破该位置将开启延续当前上涨趋势的可能。
动量指标支持这一积极态势,14日相对强弱指数(RSI)徘徊在65的看涨区域,而随机振荡器#WeekendTradingPlan Stoch则深陷超买区,暗示买盘仍占据主导,即使涨势可能变得过度。
ETH1.55%
- 赞赏
- 2
- 4
- 转发
- 分享
discovery:
到月球 🌕查看更多
🔹 战争接近结束?据报道,美国和伊朗接近于
1,435次观看
2026-04-16 10:28
- 赞赏
- 点赞
- 评论
- 转发
- 分享
🔹 特朗普命令海军封锁霍尔木兹海峡,拦截
1,384次观看
2026-04-13 07:34
- 赞赏
- 点赞
- 评论
- 转发
- 分享
Gate 第十三周年庆典已正式开启!完成全球登机任务以解锁专属票券,参与每日抽奖赢取实体金票,并享受来自超级奖池的每日奖励。https://gate.com/activities/13th-anniversary?ref_type=165&utm_cmp=iymOULZt&ref=A1kXXQxY
查看原文- 赞赏
- 4
- 6
- 转发
- 分享
discovery:
LFG 🔥查看更多
🔹 恐惧再次蔓延!指数跌至14,市场仍处于“极端”状态
1,853次观看
2026-04-09 09:34
- 赞赏
- 点赞
- 评论
- 转发
- 分享
热门话题
查看更多40.16万 热度
9429.84万 热度
11.52万 热度
184.47万 热度
82.77万 热度
置顶
🏆 WCTC S8 风云热议:晒战绩,赢豪礼
广场发帖即参与,WCTC 限量定制周边、GT、卡券等您拿!
🎁 四大奖励赛道:
1️⃣ 组队礼: 一键分享组队,抽 100 人送 50U 体验券。
2️⃣ 大神礼: 写攻略,赢 20U GT + 官方置顶。
3️⃣ 战神礼: 晒个人 PK 战绩截图,送 WCTC 纪念 T 恤。
4️⃣ 领头羊: 晒团队战绩,热度前 10 赢全场流量推广。
👉 带话题 #WCTC交易王PK 发帖,锁定你的专属奖励!
🔗 https://www.gate.com/competition/wctc-s8
详情:https://www.gate.com/announcements/article/5090710,000 USDT 悬赏,寻找Gate广场跟单金牌星探!🕵️♀️
挖掘顶级带单员,赢取高额跟单体验金!
立即参与:https://www.gate.com/campaigns/4624
🎁 三大活动,奖金叠满:
1️⃣ 慧眼识英:发帖推荐带单员,分享跟单体验,抽 100 位送 30 USDT!
2️⃣ 强力应援:晒出你的跟单截图,为大神打 Call,抽 120 位送 50 USDT!
3️⃣ 社交达人:同步至 X/Twitter,凭流量赢取 100 USDT!
📍 标签: #跟单金牌星探 #GateCopyTrading
⏰ 限时: 4/22 16:00 - 5/10 16:00 (UTC+8)
详情:https://www.gate.com/announcements/article/50848✍️ Gate 广场「创作者认证激励计划」持续招募中!
广场发帖创作,即可瓜分每月 $10,000+ 奖励!
豪华代币奖池、Gate 周边、专属推广与千万级流量曝光等你拿!
广场认证创作者、其他平台优质创作者均可报名
立即填写表单报名 👉 https://www.gate.com/questionnaire/7159
让优质内容被更多人看到,一起共建创作者社区!
活动详情:https://www.gate.com/announcements/article/47889
创作者认证申请详情:https://www.gate.com/help/community-center/moments/47731/gate-square-creator-certification-guidelines#Gate广场五月交易分享 狂欢开启,五一红包狂撒!🧧
发帖聊行情,红包天天领,新人100%中奖!
🎁 福利亮点:
✅ 新人礼: 发布广场首帖,100% 必中红包!
✅ 发帖奖: 发帖越多,互动越多,红包金额越大!
✅ 冲榜单: Top 100 都有奖,Gate X RedBull 积木赛车礼盒、速干运动套装等您拿!
立即行动,发布你的五月广场第一帖!
👉️ https://www.gate.com/post
🗓 截止日期: 5 月 15 日
详情:https://www.gate.com/announcements/article/50981
#BTC #ETH #GT📢 Gate 广场|5/6 Polymarket 每日热点预测
🎁 参与即有机会赢!随机抽取 5 位幸运用户,每人送 $5 代币
📝 参与方式:
1️⃣ 参与 Polymarket 预测投票并在评论区留言
2️⃣ 带 #Polymarket每日热点 发帖,分享您的判断逻辑与押注策略
👇 点击下方 Polymarket 卡片,立即参与预测
发帖挂载 Polymarket 卡片需将 App 更新至 8.17.0 及以上版本
详情:https://gate.onelink.me/Hls0/prediction?page=detail&event_ticker=415443&source=cex